Figures & data
Table 1 Summary of Microglia Numbers in Various Brain Areas
Figure 1 Mild, LPS-induced inflammation produces a spatially patterned microglial activation throughout the adult mouse brain. (A) Heat maps of fold changes in microglia number in each anatomical region induced by single i.p. LPS injection. Top: Purple represents brain regions examined; bottom: color scale indicates fold changes in microglia number ranging from 0 to 1.64; fold change in MHb is not included (2.61) (*p < 0.05, **p < 0.01, ***p < 0.001). (B) Representative images of MHb, LHb, CM, MDT or PVT brain regions and immunostaining for the microglial marker Iba-1 in mice injected with saline or i.p.-administered a single or 2 daily doses of LPS. (C) Quantification of the density of Iba-1+ cells. Data are means ± SEMs (n = 14~15 sections from 5 mice; *p < 0.05, ***p < 0.001, ****p < 0.0001; Mann–Whitney U-test). (D) Representative images of vCA1, vCA3, vDG, MC, SC, IC, Cla or PC brain regions and immunostaining for the microglial marker Iba-1 and CD68 in mice injected with saline or i.p.-administered a single dose of LPS. Scale bar: 25 µm (applies to all images) (E) Quantification of the colocalization percentage of Iba-1+/CD68+ cells. Data are means ± SEMs (n = 14~15 sections from 5 mice; **p < 0.01, ****p < 0.0001; Mann–Whitney U-test).
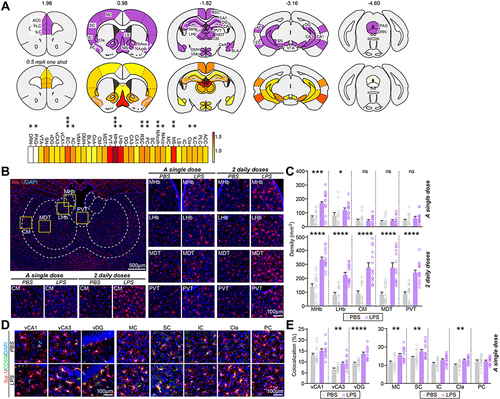
Figure 2 Mild, LPS-induced inflammation does not cause the infiltration of peripheral immune cells. Representative images showing the number of CCR2-RFP+ cells and immunostaining for the microglial marker Iba-1 (green) in the indicated brain regions of CCR2-RFP mice injected with saline or i.p.-administered a single or 2 daily doses of LPS. Yellow arrow heads indicate CCR2-RFP+ cells.
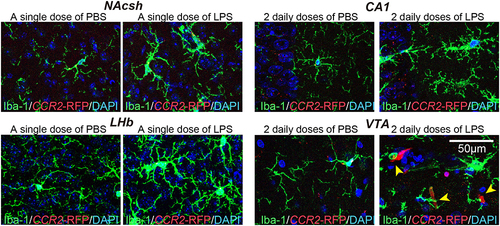
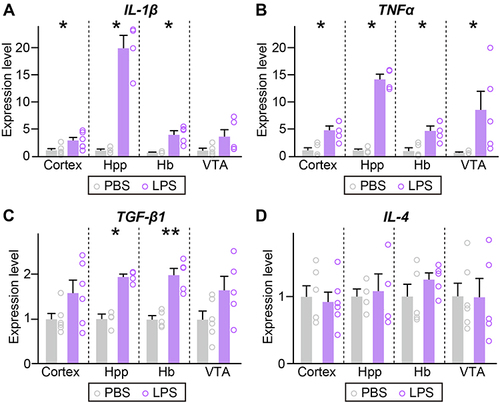
Figure 3 Mild, LPS-induced inflammation upregulates the pro-inflammatory cytokine levels. (A–D) qRT-PCR analysis of IL-1β, TNFα, TGF-β1, and IL-4 in the indicated regions of brain collected from mice i.p.-injected with saline or a single dose of LPS. (n = 4~6 mice/group; *p < 0.05, **p < 0.01; Mann–Whitney U-test).