Figures & data
Figure 1 AS-IV chemical structure.
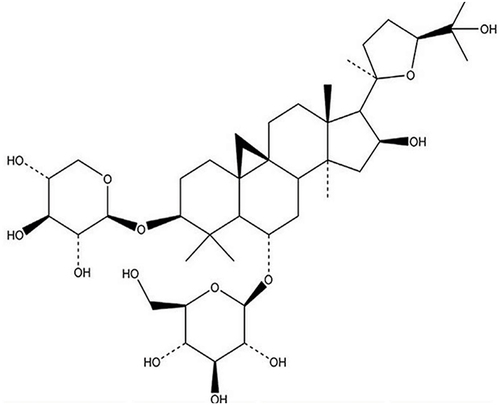
Table 1 List of Primers Used for Real-Time RT-PCR
Figure 2 AS-IV decreases miR-1 mRNA expression in the heart tissue of LPS-treated rats.
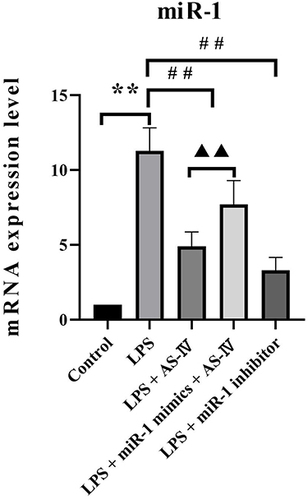
Figure 3 AS-IV improves heart dysfunction and attenuates the pathological changes of heart tissue in LPS-treated rats.
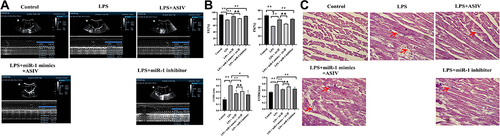
Figure 4 AS-IV reduces the levels of inflammatory cytokines in the serum of LPS-treated rats.
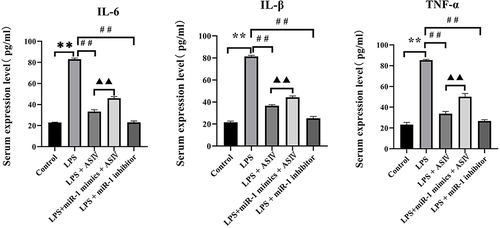
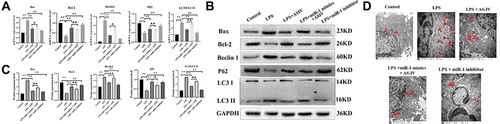
Figure 5 AS-IV regulates the protein expression of inflammation signaling molecules in the heart tissue of LPS-treated rats.
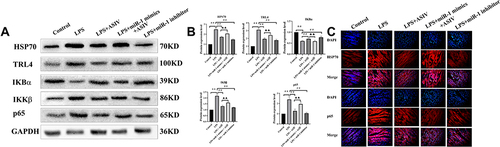
Figure 6 AS-IV regulates autophagy in the heart tissue of LPS-treated rats.
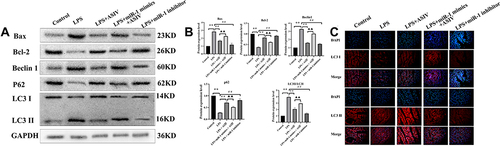
Figure 7 AS-IV decreases miR-1 mRNA expression in LPS-treated heart cells.
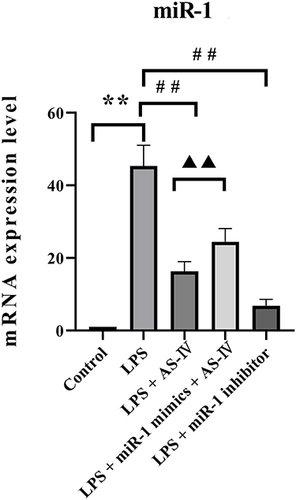
Figure 8 AS-IV regulates the protein expression of inflammation signaling molecules in LPS-treated heart cells.
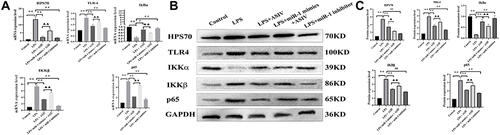
Figure 9 AS-IV regulates autophagy in LPS-treated heart cells.