Figures & data
Table 1 The Correlation of COTL1 Expression and Clinical Characteristics from TCGA (n=1104)
Table 2 The Correlation of COTL1 Expression and Clinical Characteristics in Breast Cancer Patients (n=138)
Figure 1 Expression of COTL1 in breast cancer. (A) COTL1 mRNA expression (from The Cancer Genome Atlas) in breast cancer was significantly higher than that in normal tissue. (B-L) Differences in COTL1 mRNA expression depending on stage, race, gender, age, subclasses, menopause status, histologic subtype, metastasis, TP53 mutation status, molecular and immune subtypes. (M-N) COTL1 protein expression in breast cancer tissues was higher than that in para-carcinoma tissues. Data are shown as mean ± SD, *<0.05, **<0.01, ***p < 0.001.
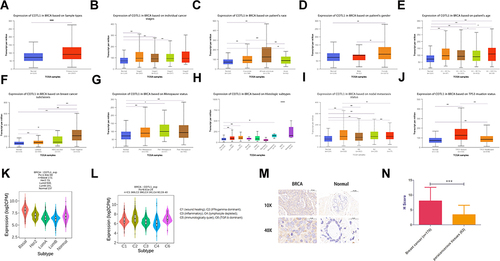
Table 3 Univariate and Multivariate Analysis of the Correlation of COTL1 Expression with Overall Survival Among Breast Cancer Patients (n=139)
Figure 2 Clinical prognosis of COTL1 in patients with breast cancer. (A-C) Survival curve based on COTL1 expression was analyzed using the Kaplan-Meier Plotter and PrognoScan database. (D) Survival curve based on COTL1 expression was analyzed by GraphPad Prism. COTL1 expression observed by IHC staining analysis was quantified using the H-score.
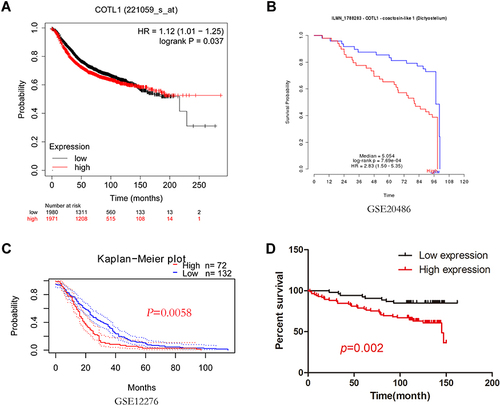
Figure 3 Function of COTL1 in breast cancer determined using the CancerSEA database. (A) Analysis from the CancerSEA database at single-cell resolution indicated that COTL1 was primarily involved in differentiation, inflammation, metastasis, and angiogenesis. (B and C) According to data from Braune EB and Jordan NV, COTL1 expression was significantly positively correlated with angiogenesis, differentiation, inflammation, and quiescence. ***p < 0.001, **p < 0.01.
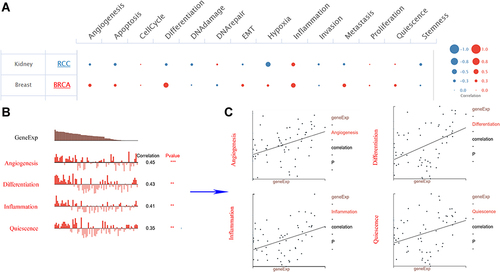
Figure 4 Function of COTL1 in breast cancer from LinkedOmics. (A) Top 50 positively and negatively regulated genes highly co-expressed with COTL1 in TCGA from the LinkedOmics database. (B) Gene set enrichment analysis (GSEA) showed the biological processes, cellular components, and molecular functions of COTL1 in BRCA. (C) Overrepresentation enrichment analysis (ORA) demonstrated that COTL1 is involved in and regulates multiple immune response. (D) COTL1 increased the immune associated factors. E. Kyoto Encyclopedia of Genes and Genomes (KEGG) pathway showed that COTL1 is involved in multiple signal pathways such as the IL-17, TNF, and B cell receptor signaling pathways.
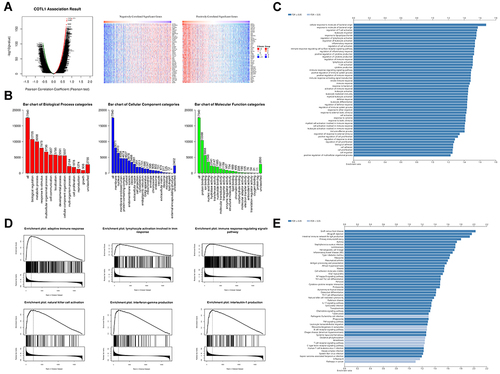
Table 4 Correlation Analysis Between COTL1 and Relate Genes and Markers of Immune Cells in BRCA by TIMER
Figure 5 Correlation of COTL1 expression with tumor immune cell infiltration (purity, B cell, CD8+ T cell, CD4+ T cell, macrophage, neutrophil, and DCs) in the TIMER database.
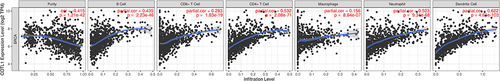
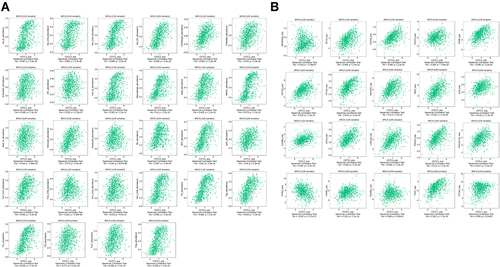
Figure 6 Correlation of COTL1 expression and lymphocyte and immune inhibitors in the TISIDB database. (A) Correlation between COTL1 expression and lymphocyte in BRCA. (B) Correlation between COTL1 expression and immune inhibitors in BRCA.