Figures & data
Figure 1 The search process is shown in this flowchart.
Figure 2 The landscape of deubiquitination-related genes in melanoma and the immune characteristics of two subtypes. (A) Protein- protein interaction (PPI) of the deubiquitination-related genes. The color and size of nodes are proportional to their degree. (B) The “clusterProfiler” R package was used for the enrichment analysis. (C) The cumulative distribution function (CDF) curves in consensus cluster analysis. CDF curves of consensus scores by different subtype numbers (k = 2, 3, 4, 5, and 6) were displayed. (D) Relative change in area under the CDF curve for k = 2–6. (E) The consensus score matrix of all samples when k = 2–6. (F) The PCA distribution of TCGA-SKCM samples by expression profile of deubiquitination related-gene. Each point represents a single sample; different colors represent the C1 and C2 subtypes respectively. (G) Survival analysis based on two subtypes. (H) Expression distribution of 116 deubiquitination-related genes between two subtypes. (I) Distribution of clinical characteristics of two subtypes, including T, N, M stages. (J–K) Differences in the abundance of immune cell infiltration (J) and immune checkpoints levels (K) between C1 and C2 subtypes. (*P < 0.05, ***P < 0.001).
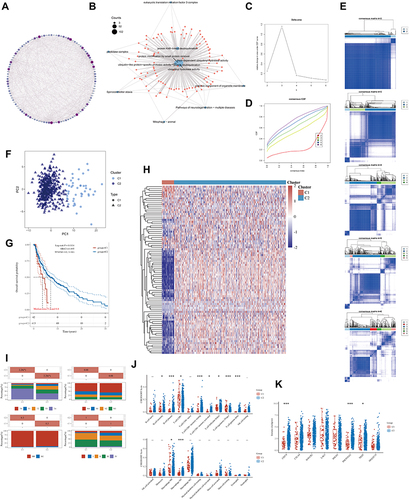
Figure 3 LASSO-Cox analysis and survival analysis. (A) least absolute shrinkage and selection operator model (LASSO) fitting. Each curve represents a gene. The profiles of coefficients were plotted versus log(λ). Vertical lines indicate the positions of seven genes with coefficients greater than 0 determined by 10-fold cross-validation. (B) λ was determined from 10-fold cross-validation. The x-axis represents log(λ); the y-axis represents binomial deviance. Optimal values calculated from minimum criteria and one standard error of the criteria are indicated by the dotted vertical lines. (C) Univariate and multivariate forest plot showing association between 5 candidate genes expression and OS/DSS in TCGA-SKCM. (D and E) The OS, DFS and DSS from the TCGA-SKCM data in relation to USP35 (D) and Z3CH12D (E) expression. (F) Differential expression of USP35 and Z3CH12D between C1 and C2 subtypes. (*P < 0.05).
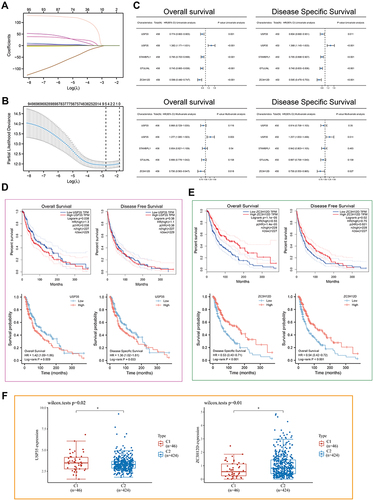
Figure 4 Expression analysis of the USP35 gene in SKCM and normal control samples. (A) Correlations between USP35 level and clinicopathological characteristics. (B) Expression of USP35 in pan-cancer. (C) Expression level of USP35 between SKCM tissues in the TCGA-SKCM cohort and control tissues in both the TCGA and GTEx databases. (D) Dataset GSE15605 and GSE114445 from GEO showing USP35 mRNA levels in SKCM. (E) Representative immunohistochemistry images of USP35 in SKCM and noncancerous skin tissues derived from the HPA database. (F) Association of USP35 mRNA expression with T/N/M stages, Clark level, pathologic stages, and Breslow depth in SKCM patients. (G and H) Distribution of USP35 expression in normal human skin at a single cell level. (I) Representative images of different immunohistochemical staining intensities for USP35 based on our own samples and statistical comparison of USP35 expression levels (H-SCORE) in paracancerous and SKCM tissue (n = 30) (* P < 0.05, ** P < 0.01, *** P < 0.001).
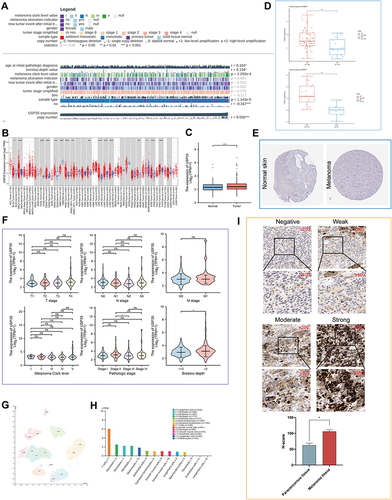
Figure 5 Function analysis of USP35. (A) Volcano map of differentially expressed genes after altered USP35 levels. Red indicates up-regulation, blue indicates down-regulation. Data on the abscissa are differences in gene expression (log2 fold change); data on the ordinate represent the significance of these differences (−log10 padj). (B) Network of USP35 and genes significantly correlated with its expression. Darker colors and larger sizes indicate higher degrees. (C) The hub module with the highest scores analyzed by Molecular Complex Detection (MCODE). (D) GO enrichment analysis of the module. (E) GO and KEGG enrichment analysis of USP35. (F and G) Gene Set Enrichment Analysis (GSEA) of USP35 high expression level group (F) and USP35 low expression level group (G). (H–K) Single-cell analysis of USP35 based on single cell RNA-seq dataset GSE72056. (H) Cellular components; (I) Uniform Manifold Approximation and Projection (UMAP) plots showing different SKCM cell types after quality control, reduction of dimensionality, and clustering; (J) UMAP plots showing expression of USP35 clusters; (K) Enrichment scores of genes from the Hallmark TORC1 signaling gene set for each cell, from gene set variation analysis; (L) Differential expression of USP35 in melanotic, amelanotic melanoma cells and normal epidermal melanocytes. (***P < 0.001).
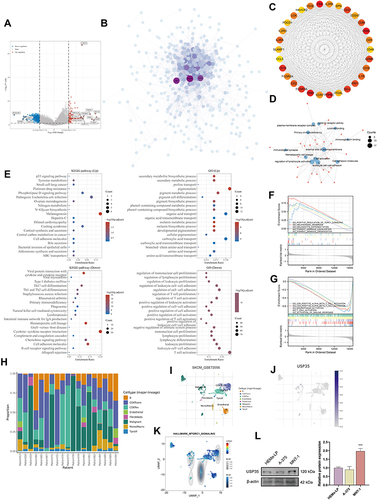
Figure 6 Relationship between USP35 levels and the abundance of immune cell infiltration. (A) Score distribution of immune cells in SKCM tissues and normal tissues, where the horizontal axis represents different groups of samples, the vertical axis represents the gene expression distribution, G1 represents the USP35 high expression group, and G2 represents the USP35 low expression group. P-values are indicated in the upper left corner and asterisks represent the level of significance. (B) Prognostic value of immune cells with statistically significant differences in abundance in SKCM. (C–E) Pearson correlation coefficients between T cells CD8+, T cells CD4+ memory activated, Macrophages M1 infiltration abundance. (F) Correlation results between USP35 levels and three types of immune cells based on five algorithms. (G) Proportion of 22 types of immune cells in SKCM samples based on GSE114445 and GSE15605 data. (H and I) Correlation between USP35 expression levels and three types immune cells abundance based on GSE114445 (H) and GSE1560 (I) data. (J) Circos plot shows the correlation between 3 marker genes from three types immune cells and USP35 level in SKCM samples based on three independent datasets. (NS: not significant, *P < 0.05, **P < 0.01, ***P < 0.001).
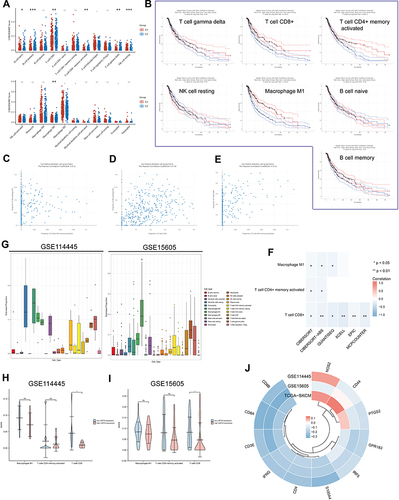
Figure 7 Significance of USP35 levels in immunotherapy. (A–C) The mRNA expression of USP35 is negatively correlated with immune checkpoint molecules expression level in TCGA-SKCM (A), GSE15605 (B), and GSE114445 (C). (D–J) Correlation between IHC staining intensity for USP35 and IHC staining intensity for immune checkpoint molecules in SKCM tissues (n = 30). Measures were taken from different samples.
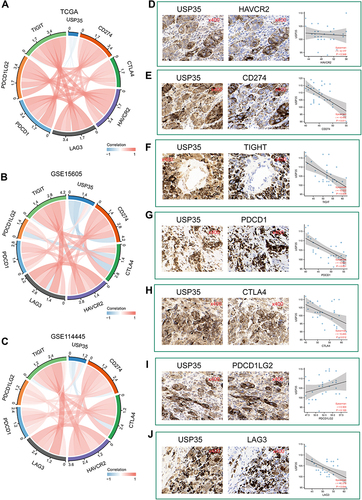
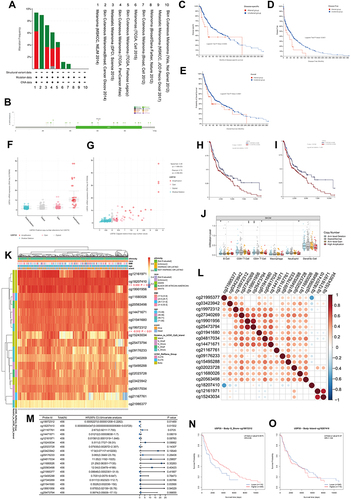
Figure 8 Genomics and DNA methylation analyses of the USP35 gene. (A) The alteration frequency of the USP35 gene for the cases in several studies was analyzed through cBioPortal. (B) The mutation site profile of the USP35 gene is shown. (C–E) OS and D/PFS analyses according to the mutation status of the USP35 gene were performed. (F) Deletion, diploid, copy number gain and amplification are involved in the deregulation of USP35. (G) Correlation between USP35 CNVs and mRNA expression. (H and I) OS (H) and PFS (I) analysis according to different CNVs status of the USP35 gene was performed. (J) The CNVs of USP35 are negatively correlated with the level of CD8+T cell in TCGA-SKCM based on TIMER2 database. (*P < 0.05, ⁑P < 0.01) (K) A waterfall plot about the methylation level of the USP35 gene is provided. (L) Correlation between all methylation probes. (M) Univariate regression analysis based on the degree of methylation of all methylation probes. (N and O) Survival analysis of two methylation probes that can be used as independent prognostic factors. (N) cg19972312; (O) cg18207410. (*P < 0.05, **P < 0.01).