
Figures & data
Figure 1 Effect of extracellular histones on apoptosis, pyroptosis and inflammasome after incubating with native or hyperacetylated extracellular histones: (A) The percentage of viable cells; (B) Annexin V/PI-positive cells after incubation with native histones and hyperacetylated histones determined by flow cytometry; (C) Caspase-1 activity measured using the Caspase-Glo® 1 Reagent kit (Promega); (D) Protein levels of caspase-3 and NLRP3 inflammasome determined by WB; (E) Caspase-3 protein levels in relation to β-actin determined by densitometry of specific bands in the WB membrane; (F) NLRP3 inflammasome levels in relation to β-actin determined by densitometry of specific bands in the WB membrane. Relative expression of inflammatory cytokines as markers of pyroptosis activation; (G) IL1B; (H) IL18; (I) IL1A gene expression determined by RT-qPCR. Data are expressed as mean±SEM from 3–5 independent experiments. *P < 0.05; **P < 0.01; ***P < 0.001 compared to histones 0μg/mL The lines at the top of columns indicate differences between compared conditions.
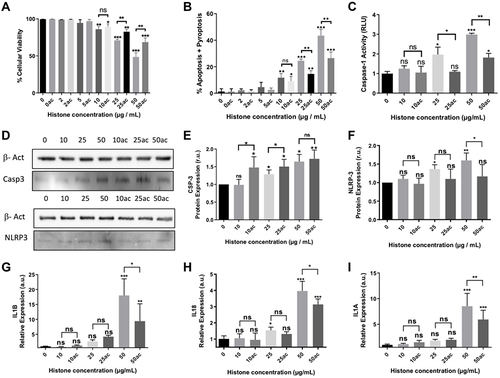
Figure 2 Analysis of oxidative stress markers, cell membrane potential and antioxidant defenses in HUVEC-treated with different concentrations of native or hyperacetylated extracellular histones. (A) Oxyblot of the carbonylated proteins and WB for oxidized Prx6-SO3, Coomassie blue gel was used as loading control for oxyblot and PRX6 total levels were used as reference of its peroxidized form; (B) Densitometry of the relative levels for carbonylated proteins and oxidized Prx6-SO3; (C) Cell membrane potential measured with the DIBAC probe by means the use of flow cytometry after counting 10,000 cells per each condition; (D) Relative expression of genes codifying for antioxidant enzymes (SOD1, SOD2, GPX1 and CAT) by RT-qPCR; (E) the WB of antioxidant enzymes (SOD1, SOD2, GPX1 and CAT); (F) Relative expression of the antioxidant enzymes quantified by densitometry of specific bands in the WB membrane and using β-actin as a loading control. (G) HUVEC cell viability and Annexin V/PI-positive cells after incubation with GSH-EE and native histones treatment analyzed by flow cytometry after counting 10,000 cells per each condition; (H) Relative expression levels of IL1A (left), IL1B (middle) and IL18 (right) determined by RT‐qPCR. Data are expressed as mean±SEM of 3–6 independent experiments. *P < 0.05; **P < 0.01; ***P < 0.001 versus histones 0μg/mL. The lines at the top of columns indicate differences between compared conditions.
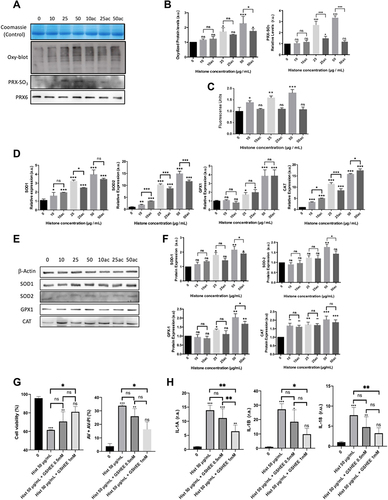
Figure 3 Extracellular histones (native and hyperacetylated) alter HUVEC prostanoid production enzymes through the up‐regulation of the COX‐Prostanoids pathway: (A) Relative COX1 and COX2 expressions determined by qRT‐PCR; (B) Representative WB images of COX-1 and COX-2 in HUVEC treated with extracellular histones for 4 h. β‐actin was used as the loading control; (C) Relative protein COX1 and COX2 levels quantified by densitometry of specific bands in the WB membrane; (D) Relative expression levels of PGIS (left) and TBXAS (right) determined by qRT‐PCR; (E) Protein levels analyzed by WB using anti‐PGIS, anti‐TBXAS and anti-eNOS. β‐actin was used as the loading control. One representative experiment of the three performed is shown; (F) Relative protein levels of PGIS and TBXAS quantified by densitometry of specific bands in the WB membrane; (G) The PGIS/TBXAS ratio of the relative levels of each protein assessed by densitometry of specific bands in the WB membrane; (H) NOS3 gene expression levels determined by RT-qPCR; (I) Relative protein eNOS levels quantified by densitometry of specific bands in the WB membrane. Densitometry was assessed by means of three independent WB experiments. Data are expressed as mean±SEM of three independent experiments. *P < 0.05; **P < 0.01; ***P < 0.001 compared to histones 0μg/mL. The lines at the top of columns indicate differences between compared conditions.
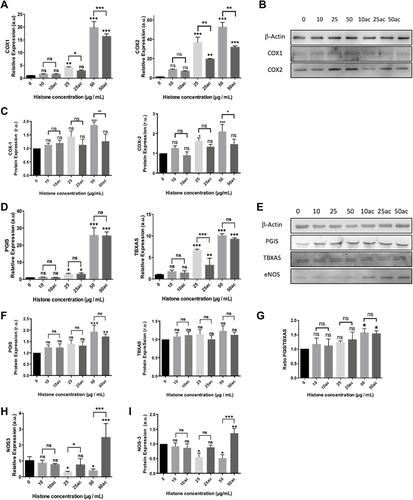
Figure 4 Expression of pro-inflammatory and endothelial adhesion factors in HUVEC exposed to 10–50μg/mL of extracellular histones (native and hyperacetylated) for 4 h. Relative expression of (A) IL6; (B) ICAM1; (C) VCAM1 and (D) eSEL gene expression levels determined by qRT‐PCR. Data are expressed as mean±SEM of three independent experiments. *P < 0.05; **P < 0.01; ***P < 0.001 versus histones 0μg/mL. The lines at the top of columns indicate differences between compared conditions.
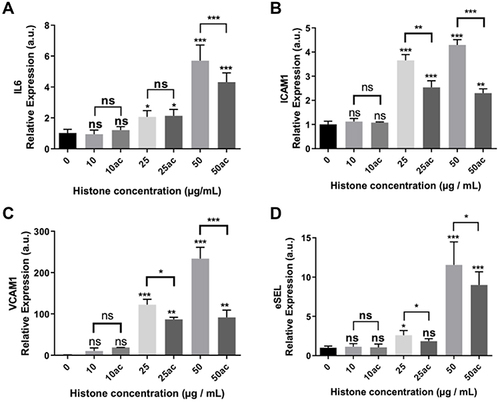
Figure 5 Inflammasome inhibition prevents subsequent effects mediated by extracellular histones in HUVEC: (A) HUVEC cell viability treated with LEHD inhibitor; (B) HUVEC cell viability treated with MCC950 inhibitor (C) HUVEC apoptosis+pyroptosis (measured as Annexin V/PI positive cells) after the challenge with extracellular histones during 4 h and MCC950 for 6 h (2 h before the challenge with 50μg/mL of extracellular histones); (D) IL1A gene expression; (E) IL1B gene expression; (F) IL18; (G) PGIS gene expression; (H) TBXAS gene expression; (I) NOS3 gene expression; (J) COX1 gene expression; (K) COX2 gene expression; (L) IL6 gene expression; (M) ICAM1 gene expression; (N) VCAM1 gene expression; (O) ESEL gene expression measured by RT-qPCR. Data are expressed as mean±SEM of three independent experiments. *P < 0.05; **P < 0.01; ***P < 0.001 compared to histones 0μg/mL. The lines at the top of columns indicate differences between compared conditions.
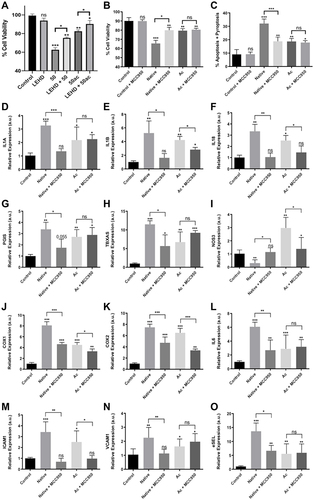
Table 1 Clinical Data of the ICU, Sepsis and SS Patients
Figure 6 Levels of circulating markers in plasma of patients admitted in the ICU. (A) Circulating histones levels referred to as the sum of H2B, H3 and H4 concentrations in plasma determined by MRM-MS; (B) Caspase-1 levels; (C) IL-1β levels; (D) IL-18 levels; (E) IL-1α levels; (F) IL-6 levels; (G) TNF-α; (H) IL-8; (I) sl-ICAM-1 levels; (J) e-SEL levels. Data are expressed as mean±SEM from two independent analysis. *P < 0.05; **P < 0.01; ***P < 0.001. The lines at the top of columns indicate differences between compared conditions.
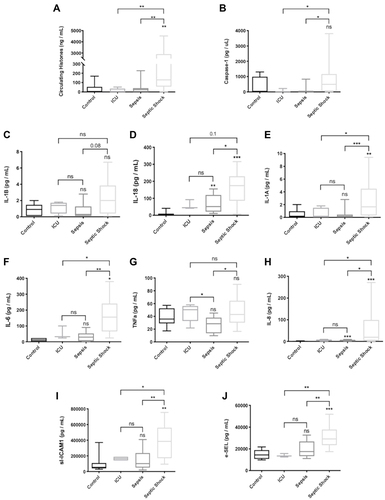
Table 2 Correlation Between Circulating Histones and Clinical Parameters Measured