Figures & data
Figure 1 The disease activity index (DAI) after administration of three cycles of 1.0% dextran sulfate sodium (DSS) or H2O as the control (means ± SEM).
Notes: (A) After administration of 1.0% DSS, the DAI in WT1 mice was significantly elevated, in comparison with the H2O control group (P ≤ 0.05). Cyclic administration of DSS in Mapk8−/− animals resulted in mild triphasic colitis, with no significant differences in comparison with the H2O control group or the WT1 DSS group (statistical evaluation: ANOVA over all time points). (B) After administration of 1.0% DSS in the WT2 animals, the DAI was not significantly elevated, in comparison with the H2O control group. Cyclic administration of DSS in Mapk9−/− animals resulted in mild triphasic colitis, which was significantly greater, in comparison with the H2O control group (P ≤ 0.001) and in comparison with the WT2 DSS group (P ≤ 0.05) (statistical evaluation: ANOVA over all time points).
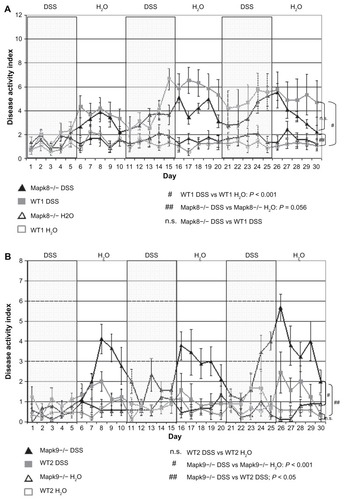
Figure 2 The crypt damage score (CDS) after administration of three cycles of 1.0% dextran sulfate sodium (DSS) or H2O as the control (means ± SEM).
Notes: The most affected regions were the mid-colon and distal colon. (A) Differences in the CDS in JNK1 knockout (Mapk8−/−) and wild-type controls (WT1) did not reach statistical significance (CDS value comparison: one-way ANOVA; pair comparisons: Tukey’s test). (B) In the DSS-treated Mapk9−/− group, the CDS was significantly elevated, in comparison with the DSS-treated WT2 group (mid-colon, P = 0.034; distal colon, P = 0.047) and with the H2O control group (mid-colon, P = 0.001; distal colon, P = 0.047) (CDS value comparison: one-way ANOVA; pair comparisons: Tukey’s test).
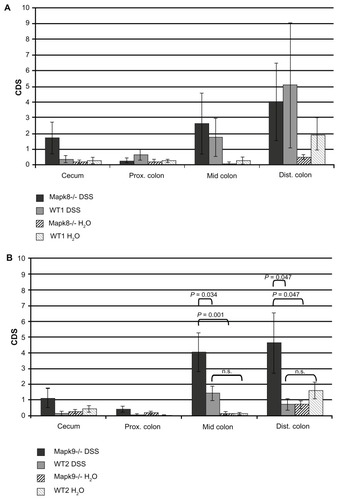
Figure 3 Hematoxylin–eosin staining of the distal colon.
Notes: (A) Wild-type controls (WT2) treated with H2O: normal mucosa with a regular crypt architecture. (B) JNK2 knockout mice (Mapk9−/−) treated with H2O: normal mucosa with a regular crypt architecture. (C) Wild-type controls (WT2) treated with three cycles of 1.0% dextran sulfate sodium (DSS): mild changes in the crypt architecture. (D) JNK2 knockout mice (Mapk9−/−) treated with three cycles of 1.0% DSS: severe changes in the crypt architecture, with ulceration and loss of crypts.
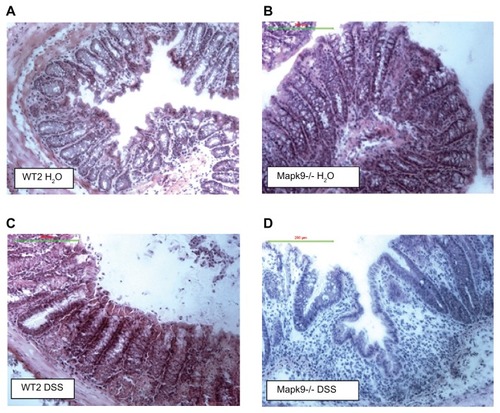
Table 1 Relative mRNA expression (mean ± SEM) for TNFα, TGFB1, and IL-6
Figure 4 Immunofluorescence (Cy3-conjugated antibody) of CD8+ cells in the distal colon.
Notes: (A) Wild-type controls (WT2) treated with H2O. (B) JNK2 knockout mice (Mapk9−/−) treated with H2O. (C) Wild-type controls (WT2) treated with three cycles of 1.0% dextran sulfate sodium (DSS). (D) JNK2 knockout mice (Mapk9−/−) treated with three cycles of 1.0% DSS.
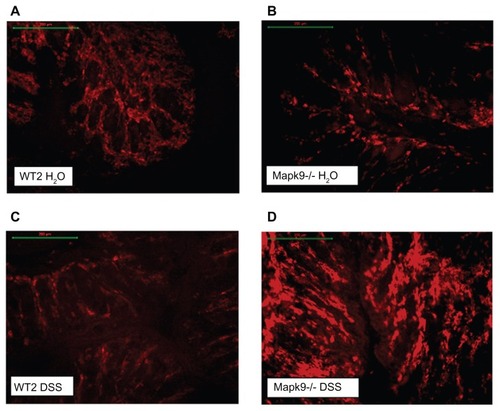
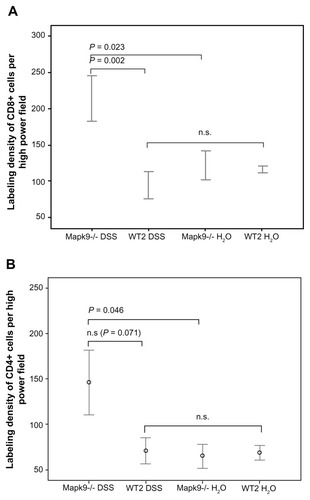
Figure 5 The labeling density of CD8 and CD4 (cells per high-power field) after administration of three cycles of 1.0% dextran sulfate sodium (DSS) or H2O as the control.
Notes: (A) After induction of chronic DSS colitis, CD8 staining was significantly higher in Mapk9−/− animals, in comparison with WT2 mice (P = 0.002). CD8 staining was also significantly elevated in Mapk9−/− animals treated with DSS, in comparison with Mapk9−/− animals treated with H2O (P = 0.023) (statistical evaluation: t-test). (B) There was significantly greater staining in Mapk9−/− animals treated with DSS, in comparison with Mapk9−/− animals treated with H2O (P = 0.046). In DSS-treated Mapk9−/− animals, CD4 staining was greater, but did not show any significant differences in comparison with DSS-treated WT2 mice (P = 0.071) (statistical evaluation: t-test).