Figures & data
Table 1 Comparison of Baseline Clinicopathological Characteristics Between the Training and Validation Dataset
Table 2 The Relationship Between LCR Grade and Other Clinicopathological Characteristics in Training and Validation Sets
Figure 1 Kaplan-Meier curves for the overall survival (OS) of patients based on lymphocyte/c-reactive protein ratio (LCR).
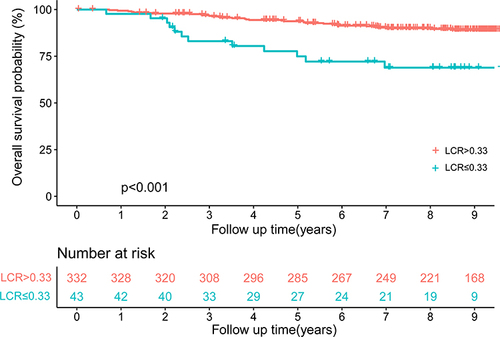
Figure 2 Kaplan-Meier curves for the overall survival (DFS) of patients based on lymphocyte/c-reactive protein ratio (LCR).
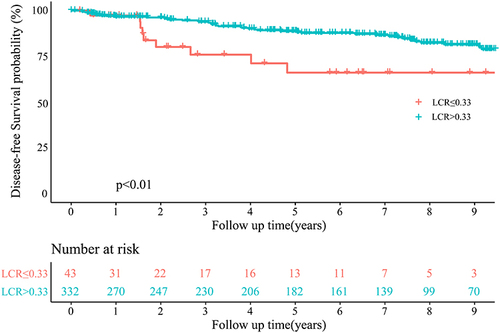
Table 3 Univariate and Multivariate Cox Regression Analysis of OS in Training Set
Table 4 Univariate and Multivariate Cox Regression Analysis of DFS in Training Set
Figure 3 Development of the prognostic signature of OS. (A) Results of the stepwise multivariate Cox regression analysis in the training dataset. (B) A nomogram of the current prognostic model for individualized OS time predictions.
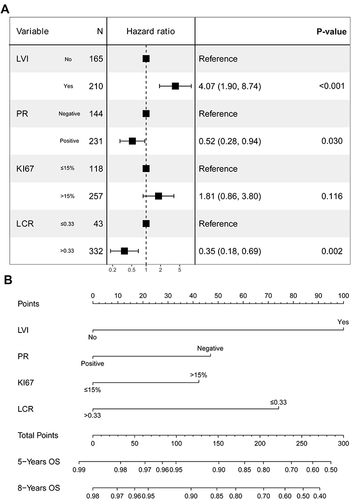
Figure 4 Development of the prognostic signature of DFS. (A) Results of the stepwise multivariate Cox regression analysis of DFS in the training dataset. (B) A nomogram of the current prognostic model for individualized DFS time predictions.
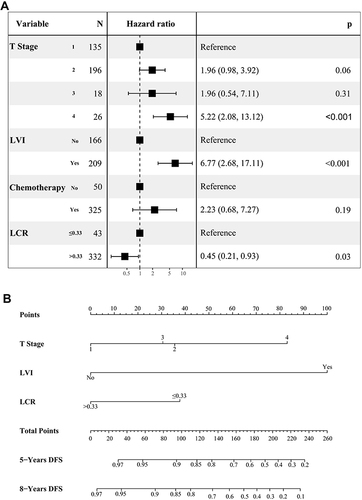
Figure 5 The validation of the prognostic model of OS. (A) Receiver operating characteristics (ROC) curves in training dataset. (B) Receiver operating characteristics (ROC) curves in validation dataset. (C) Calibration plot of the nomogram model at 5-year in the training dataset. (D) Calibration plot of the nomogram model at 8-year in the training dataset. (E) Calibration plot of the nomogram model at 5-year in the validation dataset. (F) Calibration plot of the nomogram model at 8-year in the validation dataset.
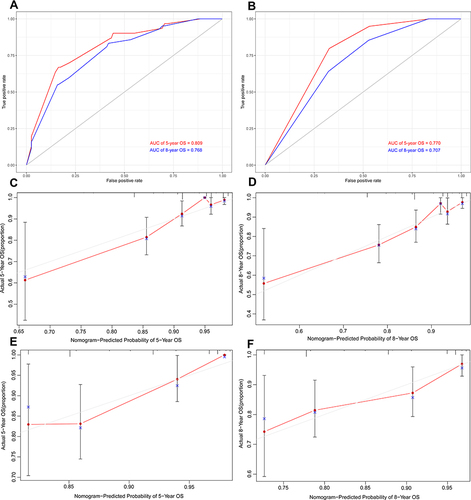
Figure 6 The validation of the prognostic model of DFS. (A) Receiver operating characteristics (ROC) curves in training dataset. (B) Receiver operating characteristics (ROC) curves in validation dataset. (C) Calibration plot of the nomogram model at 5-year in the training dataset. (D) Calibration plot of the nomogram model at 8-year in the training dataset. (E) Calibration plot of the nomogram model at 5-year in the validation dataset. (F) Calibration plot of the nomogram model at 8-year in the validation dataset.
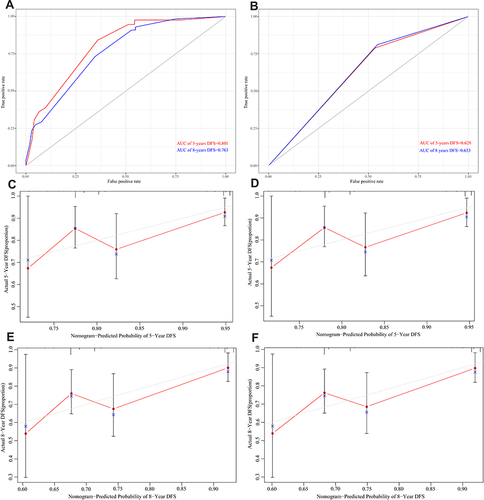
Figure 7 Overall survival analysis based on risk scores. (A) The distribution and the median value of the risk scores in the training dataset. (B) The distribution and the median value of the risk scores in the validation dataset. (C) Kaplan-Meier curves for the OS of patients in the high- and low-risk group in the training dataset. (D) Kaplan-Meier curves for the OS of patients in the high- and low-risk group in the validation dataset. (E) The distributions of OS status, OS and risk scores in the training dataset. (F) The distributions of OS status, OS and risk scores in the validation dataset.
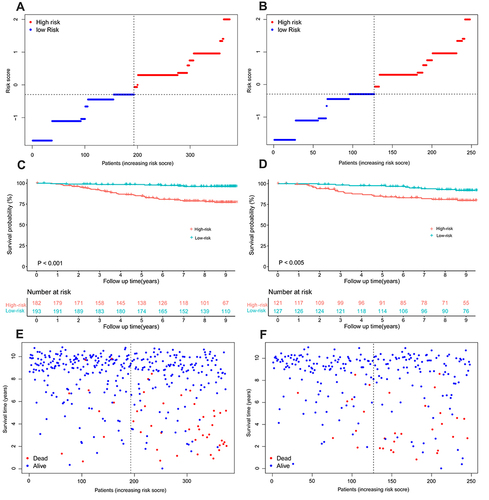
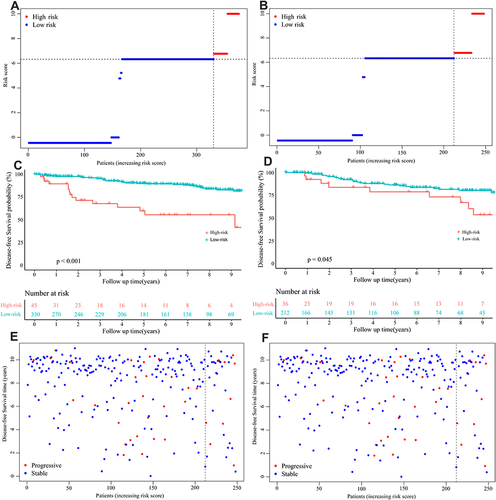
Figure 8 Disease-free survival analysis based on risk scores. (A) The distribution and the median value of the risk scores in the training dataset. (B) The distribution and the median value of the risk scores in the validation dataset. (C) Kaplan-Meier curves for the DFS of patients in the high- and low-risk group in the training dataset. (D) Kaplan-Meier curves for the DFS of patients in the high- and low-risk group in the validation dataset. (E) The distributions of DFS status, DFS and risk scores in the training dataset. (F) The distributions of DFS status, DFS and risk scores in the validation dataset.