Figures & data
Table 1 Gene Frequency Distribution of TLR2, TLR4 and CD14 Alleles
Table 2 Distribution of Selected Variables Among Cases and Controls
Table 3 Genotype and Allele Frequencies in TLR2, TLR4 and CD14 Polymorphisms Among Cases and Controls
Table 4 Stratification Analyses of TLR2, TLR4 and CD14 Polymorphisms in the Dominant Model in Cases and Controls
Table 5 Multifactor Dimensionality Reduction Models for Locus–Locus Interactions
Figure 1 Tree diagram of the best genotype models. The distance between single nucleotide polymorphisms (SNPs) indicates the intensity of the interactions. The color indicates the type of interactions. Red, orange, and green denote strong, moderate and weak interactions, respectively. A1: rs7656411; A3: rs7682814; A6: rs1927914; A8: rs2563298; A10: rs2569191.
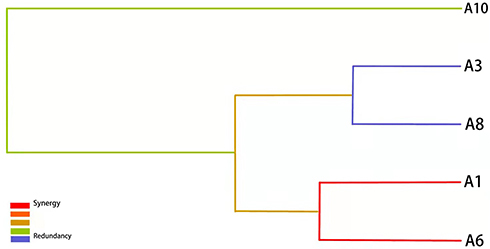
Table 6 Statistics of Environmental Factors in AR Case Group
Table 7 Association Between Polymorphisms and Environmental Factors in the Dominant Model Among AR Case Group
Table 8 Functional Annotation Information of 10 SNPs
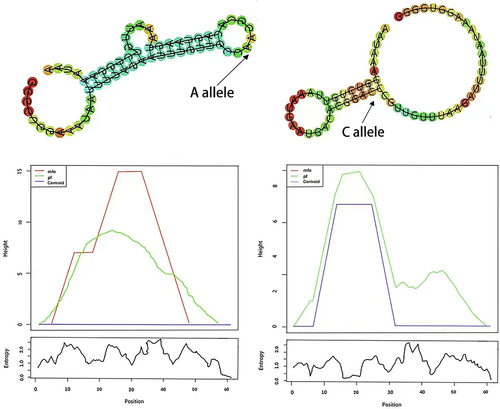
Figure 2 In silico prediction of CD14 folding structures and minimum free energy (MFE) changes corresponding to rs2563298 A to C allele. The arrows indicated the changes in structure caused by rs2563298.