Figures & data
Table 1 Baseline Characteristics According to Preprocedural SII Level Categories
Figure 1 The incidence of CA-AKI in the four groups.
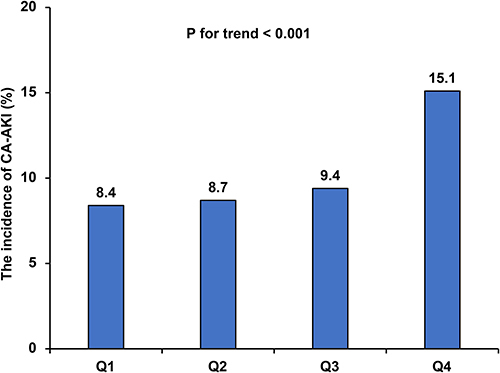
Figure 2 The incidence of one-year mortality in the four groups.
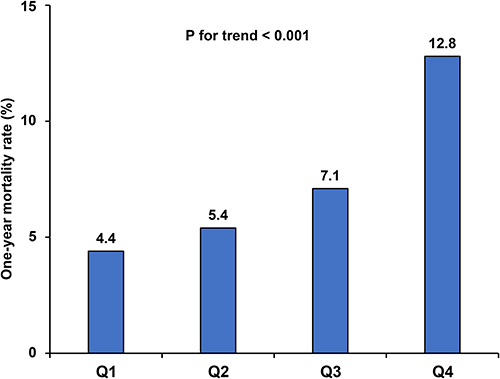
Figure 3 Kaplan–Meier curve in terms of all-cause mortality according to the preprocedural SII quartiles.
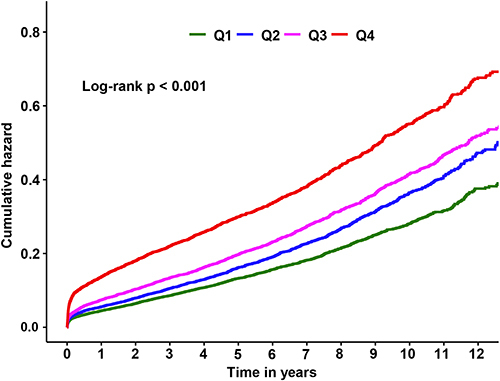
Table 2 Univariable and Multivariable Logistic Regression Analysis of the Association Between Preprocedural SII Level and CA-AKI Following CAG
Figure 4 Multivariable logistic regression analysis for association between preprocedural SII and CA-AKI in different models. Model 1 was unadjusted; model 2 was only adjusted for age and gender; model 3 was adjusted for ACEI_ARB, Age, AMI, Anemia, CAD, CMV, CHF, DM, eGFR, gender, HT, HDL-C, IABP, LDL-C, PCI, Statins.
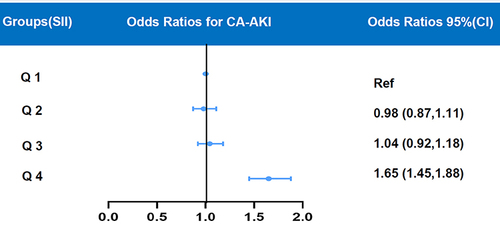
Figure 5 Restricted spline curve for the CA-AKI adjusted odds ratio.
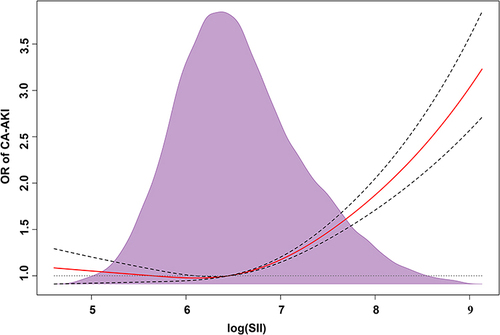
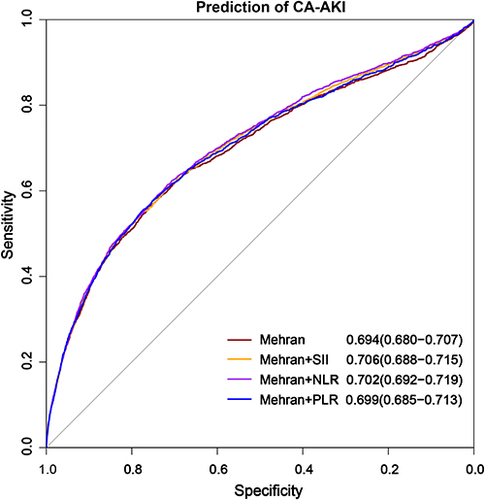
Figure 6 Receiver operator characteristics curves of Mehran risk score, Mehran+SII, Mehran+NLR and Mehran+PLR model.