Figures & data
Figure 1 Viability of RAW264.7 cells stimulated with different concentrations of CV extract in the presence or absence of the following inhibitors: TAK-242 (Toll-like receptor 4 inhibitor; (A)), JSH-23 (nuclear factor κB inhibitor; (B)) or LY294002 (phosphoinositide 3-kinase inhibitor (C)). Cell viability was assessed using the MTT assay. The results are presented as a percentages of the control cells cultured in DMEM (served as 100%; dash lines). The data are shown as the mean ± standard error of two independent experiments with six wells in each experiment. Asterisk denotes differences between the cells treated with the CV extract and/or the inhibitors compared with the control cells (*p < 0.05).
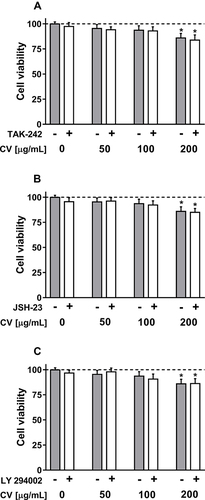
Figure 2 Effects of the selective inhibitors on the production of IL-6 (A–C) and TNF-α (D–F) in CV extract-stimulated RAW 264.7 cells. Cells were pre-treated with TLR4 inhibitor (TAK-242; 0.1 µM), NF-κB inhibitor (JSH-23; 10 µM), and PI3K inhibitor (LY294002; 2 µM) for 2 h prior to stimulation with CV extract (50, 100 and 200 µg/mL) for 24 h. Data are shown as the mean ± SEM of two independent experiments with five wells in each experiment. The concentration of the cytokines in the culture media was normalized to the total protein amount of the viable cell pellets and measured using ELISA. Asterisks indicate significant differences between the cells stimulated with the CV extract alone and the cells co-treated with the CV extract and the inhibitors (*p < 0.05; **p < 0.01; ***p < 0.001).
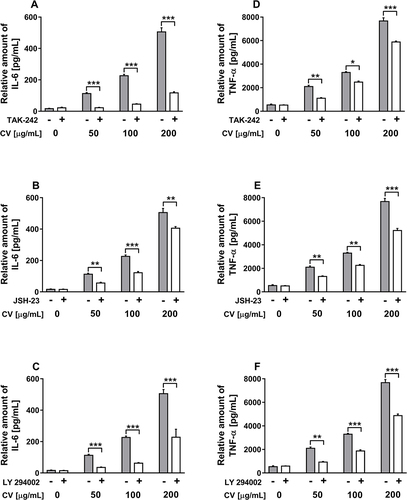
Figure 3 Effect of CV extract on the production of IL-6 (A–C) and TNF-α (D–F) by RAW 264.7 cells stimulated with LPS. The cells were stimulated with various concentration of LPS alone (10, 100 and 500 ng/mL; grey bars) or with a combination of LPS and various doses of the CV extract (50, 100 and 200 µg/mL) for 24 h. The levels of pro-inflammatory cytokines released into the culture media were determined using ELISA assays. Data are shown as the mean ± SEM of two independent experiments with five wells in each experiment. The concentration of the cytokines was normalized to the total protein amount of the viable cell pellets. Asterisks indicate significant differences between the cells stimulated with LPS alone in comparison with the cells co-treated with the CV extract and LPS (*p < 0.05; **p < 0.01; ***p < 0.001).
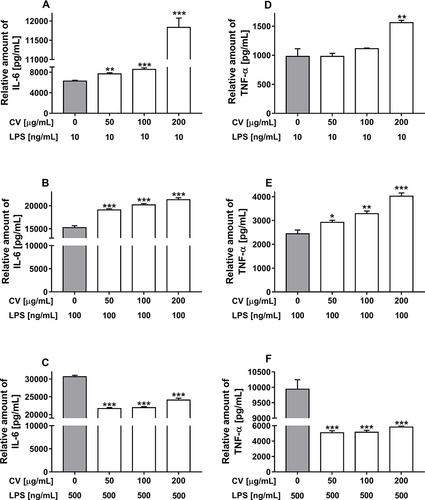
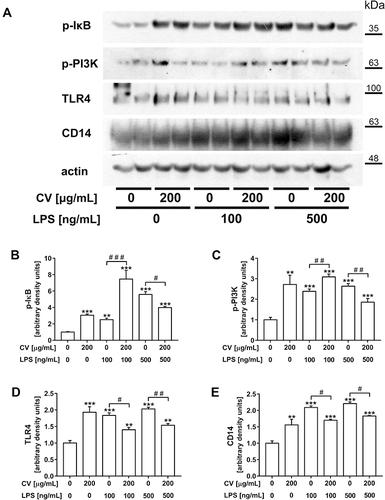
Figure 4 Representative Western blot images of p-IκB, p-PI3K, TLR4 and CD14 in RAW 264.7 cells co-stimulated with CV extract and LPS (A). The cells were stimulated only with CV extract (200 µg/mL) or LPS itself (100 or 500 ng/mL) or co-treated with CV extract and LPS for 1 h. Relative densitometric bar graphs showing the levels of p-IκB (B), p-PI3K (C), TLR4 (D) and CD14 (E) in the cell lysates were analysed by immunoblotting relative to the actin content. The blots were quantified by densitometry using the ImageJ software; results are expressed as a fold-change compared to unstimulated control cells. Data are shown as the mean ± SEM of three independent experiments with two repetition in each experiment. Asterisks indicate significant differences between stimulated and untreated cells (**p < 0.01; ***p < 0.001). Hash marks indicate a significant difference between the cells stimulated with the respective dose of LPS alone and the cells co-treated with LPS and CV extract (#p < 0.05; ##p < 0.05; ###p < 0.05).