Figures & data
Figure 1 Chondrocyte hypertrophy during human OA development. (A) HE and SafO staining of knee cartilage at different osteoarthritis (OA) stages. The different Mankin Score ranges which classified OA stages were listed in brackets. The superficial zones of human cartilage were wearing off and the radial zones were thickening along with the increase of OA severity. Interestingly, the average age of the samples in different level of OA was also increasing. The dashed lines depict the boundaries between the superficial, transitional and radial zones. The average age of the human samples in different stages of OA was shown as mean±SD. Scale bars:100μm. (B) Immunohistochemistry for histone deacetylase 4 (HDAC4) and type X collagen of Nearly Normal and Early OA patient knee cartilage. Type X collagen expression is localized in the transitional and radial zones, paralleling the staining pattern of HDAC4. Scale bars:50μm. (C–E) Positive cell ratio of type X collagen and HDAC4 in different zones of normal and OA patient knee cartilage. (C) superficial zone; (D) transitional zone; (E) radial zone, n=6 for both groups; *P <0.05,**P <0.01, Student’s t-test.
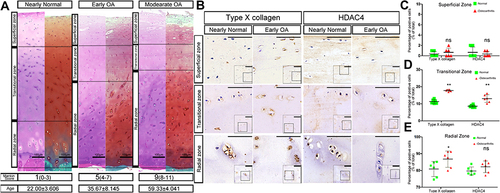
Figure 2 Generation and evaluation of Acan-CreERT2-HDAC4fl/fl mice. (A) Schematic representation of the Acan-CreERT2-HDAC4fl/fl transgenic mice. The upper panel shows the offspring of mice with histone deacetylase 4 (HDAC4) homologous recombination and Acan-Cre recombination. The bottom panel shows the deletion of the HDAC4 gene after the activation of the Cre enzyme by tamoxifen injection. (B) Acan-CreERT2-HDAC4fl/fl mouse genotyping using PCR. Acan-CreERT2 (lanes 1, 2 and 3): lane 1, Cre homozygous (200 bp); lane 2, Cre heterozygous (200 bp and 299 bp); lane 3, wild type Acan (299 bp), HDAC4fl/fl (lanes 5, 6 and 7): lane 4, HDAC4fl/fl homozygous (620 bp); lane 5, HDAC4fl/fl heterozygous (620 and 520 bp); lane 6, HDAC4 wild type (520 bp), Marker: lane 4, 1000 bp DNA ladder. (C) Phenotype of 2-month-old Acan-CreERT2-HDAC4fl/fl and wild-type mice. X-ray. Micro Ct and SafO stain images shows no apparent deformation (the defection of bone structure between the articular surface and tibia represent the cartilage zone of mice epiphyseal line). Scale bars:100μm. (D) Early osteoarthritis (OA) is shown in 8-month-old HDAC4-null mice. After the tamoxifen injection at 2-months-old, the mutant mouse knee shows early OA characterization at 8-months-old. n=18. 2 mice/month. Scale bars:100μm.
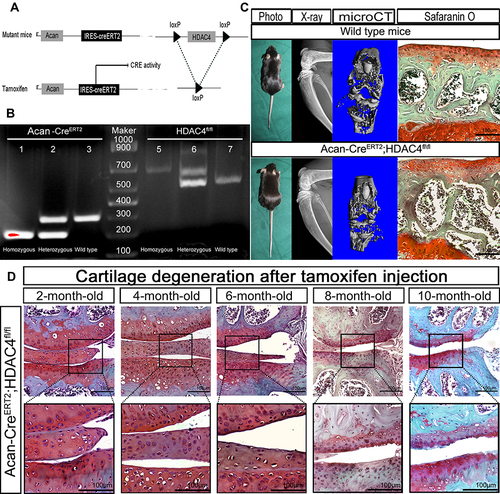
Figure 3 Eight-month-old mice experienced early osteoarthritis (OA) after histone deacetylase 4 (HDAC4) knock out. (A) The relative mRNA expression of HDAC4 was significantly reduced after tamoxifen injection in 2-month-old mice. (B) Positive HDAC4 staining was hardly seen in the cartilage of 8-month-old AggH-Tam mice. Scale bars:50μm. (C) Quantitative analysis of HDAC4 expression showed that HDAC4 expression was consistently reduced up to the age of 8-months. (D) Safranin O staining of 8-month-old mice in all three groups showing OA changes in the AggH-Tam group. The dotted line shows where the surface of the cartilage should be. Scale bars:50μm. (E) Osteoarthritis Research Society International (OARSI) scores for all three groups showing significant OA changes in AggH-Tam group mice at the early stage of OA progression. (F) Osteophytes and thickened synovium were observed in 8-month-old AggH-Tam group mice. The dotted line shows the outgrowing osteophyte of the knee joint. The black line in the image indicates the thickened synovium. Scale bars:50μm.
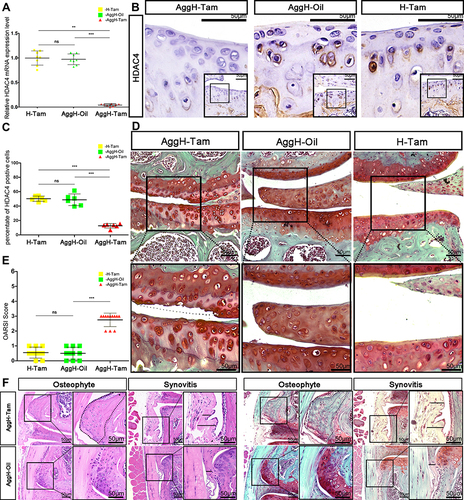
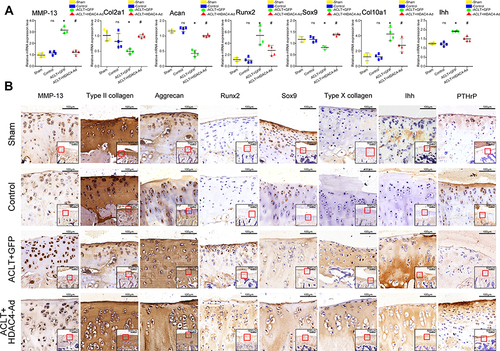
Figure 4 Histone deacetylase 4 (HDAC4) deletion induced diverse changes in osteoarthritis (OA)-related genes in mice. (A–C) HDAC4 knockout led to significant differences in the relative mRNA expression of OA-related genes between the AggH-Tam and AggH-Oil groups in 8-month-old. Data are shown as the mean ± SD. The results were normalized to 18S mRNA. *P < 0.05, **p < 0.01, ***p < 0.001. (D) Matrix metalloprotease 13 (MMP-13), type II collagen, aggrecan, Runt-related transcription factor 2 (Runx2), SRY-box transcription factor 9 (Sox9), type X collagen, Indian hedgehog (Ihh), and parathyroid hormone-related protein (PTHrP) immunochemical staining of the different groups. And the relative locations were indicated by the red frame in the bottom right corner of each picture. Scale bars: 50 μm.
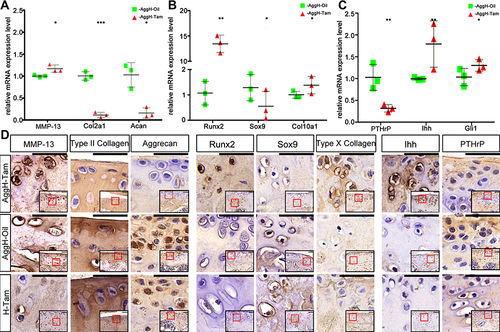
Figure 5 Osteoarthritis (OA) progression decelerated after the intra-articular injection of histone deacetylase 4 (HDAC4) in rats. (A) Fluorescence microscopy images of HDAC4-green fluorescent protein (GFP) chondrocytes with DAPI staining. Scale bars:50μm. (B) HE and SafO staining of rat knee joints at three months after the procedure. Mice in the Control group receive no intervention. Typical OA was observed in the ACLT+GFP group. Milder OA was observed in the ACLT+HDAC4-Ad group. Scale bars for Up panel images were 500μm. And Scale bars for down panel images were 100μm. (C) Mankin scores were analyzed to quantify the degree of OA. With the intra-articular injection of HDAC4, the progression of OA was decelerated. *P < 0.05, ACLT+GFP vs Control; #P < 0.05, ACLT+HDAC4-Ad vs ACLT+GFP; n = 5 pre group.
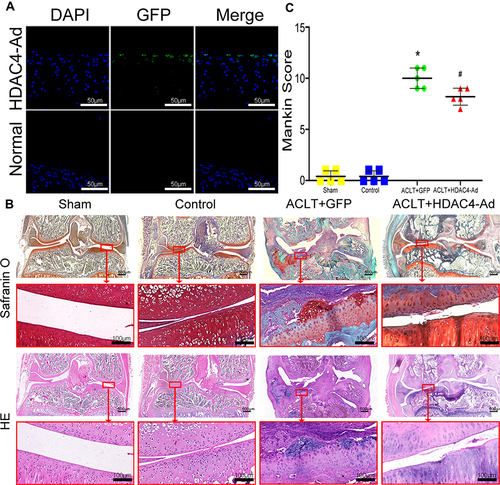
Figure 6 Expression level changes of osteoarthritis (OA)-related genes after histone deacetylase 4 (HDAC4)-Ad transfection in rats. (A) qPCR analysis of OA-related genes after HDAC4-Ad transfection. Collagen type II alpha 1 chain (COL2A1) and aggrecan (Acan) expression were reduced in the ACLT+GFP group. Furthermore, the expression levels were relatively increased in the ACLT+HDAC4-Ad group when compared to the ACLT+GFP group. Matrix metalloprotease 13 (MMP-13), Runt-related transcription factor 2 (Runx2), the alpha chain of type X collagen (Col10a1), and Indian hedgehog (Ihh) expression was significantly increased in the ACLT+GFP group. Moreover, the expression levels were relatively decreased in the ACLT+HDAC4-Ad group when compared to the ACLT+GFP group. Data are shown as the mean±SD. ns, P > 0.05, Control vs Sham; *P < 0.05, ACLT+GFP vs Control; #P< 0.05, ACLT+HDAC4-Ad vs ACLT+GFP; n = 4 pre group. The results were normalized to GAPDH mRNA. (B) Immunochemical analysis of OA-related genes after transfection with HDAC4-Ad. These results were consistent with those of qPCR analysis. COL2A1 and Acan expression were reduced in the ACLT+GFP group. Moreover, the expression levels were relatively increased in the ACLT+HDAC4-Ad group when compared to the ACLT+GFP group. MMP-13, Runx2, Col10a1, and Ihh expression was increased in the ACLT+GFP group. Furthermore, the expression levels were relatively decreased in the ACLT+HDAC4-Ad group when compared to the ACLT+GFP group. The images show the immunohistochemical staining of cartilage. Scale bars: 100μm. And the relative location was indicated by the red frame in the bottom right corner of the picture. Scale bar: 500μm.