Figures & data

Figure 1 Method and Study Procedure. (A) Study grouping. (B) Procedure for Nasal irrigation. (C) Study Procedure.
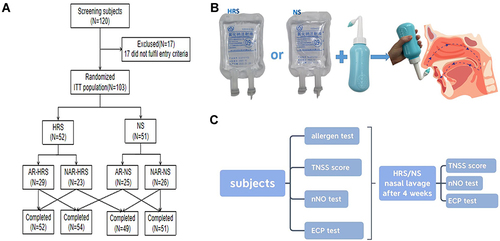
Table 1 Baseline Comparison of the Study Subjects
Figure 2 Comparison of various indicators of CR between the HRS and NS groups. (A) TNSS scores for the HRS group decreased significantly compared to the NS group after four weeks of treatment (P=0.043<0.05), especially in TNSS scores for nasal itching in the AR-HRS group which was higher than the control group (P=0.04<0.05). (B) nNO levels in the two groups decreased significantly after treatment (both P=0.000<0.05), however, no statistical significance was observed (P=0.139>0.05). (C) Both groups showed an obvious decrease in ECP after treatment. ECP levels in the HRS group decreased more significantly compared to the NS group (P=0.029<0.05). (D) After treatment, the proportion of Treg in the two groups increased slightly, but no significant differences were observed between the two groups (P=0.648>0.05). (E) After treatment, the proportion of Breg in the two groups decreased slightly, with no significant difference between the two groups (P=0.493> 0.05). *Significantly different from the HRS group (p<0.05).
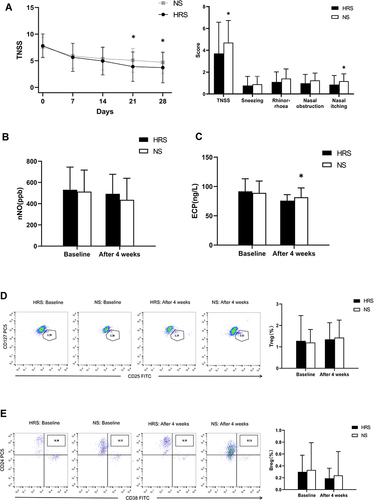
Figure 3 Comparison of various indicators in the AR subgroup. (A) The TNSS scores in the AR-HRS subgroup decreased significantly compared to the NS group after four weeks of treatment (P=0.001<0.05), especially for symptoms of runny nose, nasal obstruction, and nasal itching in the AR-HRS group which had higher TNSS compared to the control group (both P<0.05). (B) nNO levels in the two groups decreased significantly after treatment (both P<0.05), but no statistical significance between the two treatment groups were observed (P=0.401>0.05). (C) ECP for both groups decreased after treatment (both P<0.05), but no significant difference between two groups were observed (P=0.758>0.05). (D) After treatment, Treg proportions decreased in the AR-HRS group (P=0.01<0.05) and increased in the control group (P=0.000<0.05), but no significant difference between the two groups were observed (P=0.803>0.05). (E) After treatment, Breg proportions decreased in the AR-HRS group (P=0.002<0.05), but no significant difference between the groups were observed (P=0.322>0.05).*Significantly different from the AR-HRS group (P <0.05).
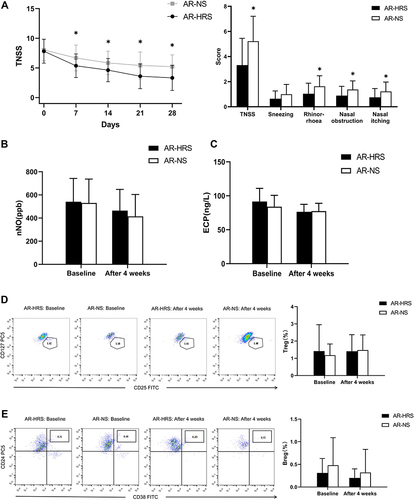
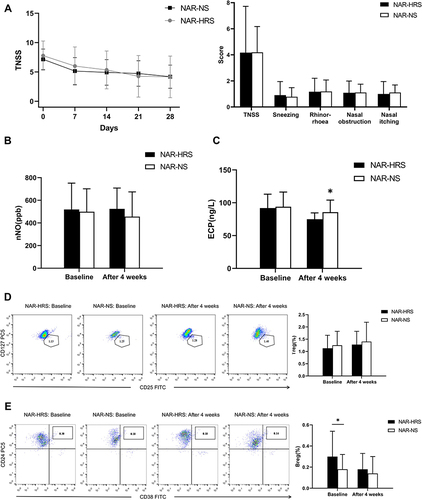
Figure 4 Comparison of various indicators in the NAR subgroup. (A) There was no significant difference in TNSS between the two treatment groups (P=0.989>0.05). (B) There were no significant differences in nNO levels within and between the two groups after treatment (P=0.291>0.05). (C) After treatment, ECP levels decreased significantly in both groups, while ECP levels in the NAR-HRS group decreased slightly, with a significant difference (P=0.016<0.05). (D) After treatment, Treg proportion in the two groups increased after treatment (both P=0.001<0.05). However, no significant difference between the two groups were observed (P=0.6>0.05); (E) After treatment, Breg proportions decreased in NAR-HRS group (P=0.00<0.05), but no significant difference between the groups were observed (P=0.472>0.05).*Significantly different from the NAR-HRS group (p<0.05).