Figures & data
Figure 1 Typical chromatograms for LC-MS method specificity and selectivity. The retention times of representative peptides for rat COXs and human COXs were at 4.9, 2.6, 5.8 and 6.5 min, respectively (A–D). For Raw264.7 cells with LPS treatment, signal was only detected in rodent COX-2 MRM transition while it was below the detection limit in rodent COX-1 transition (E and F). No interference was found in human COX-1 and COX-2 transition (G and H). For EOMA cells with LPS treatment, signal was detected in rodent COXs’ transitions but not interfered in human COXs’ transitions (I–L). Similarly, the signal was only detected in human COXs’ transitions for the human recombinant enzymes samples and no background interference was found in rodent COXs’ transitions (M–T).
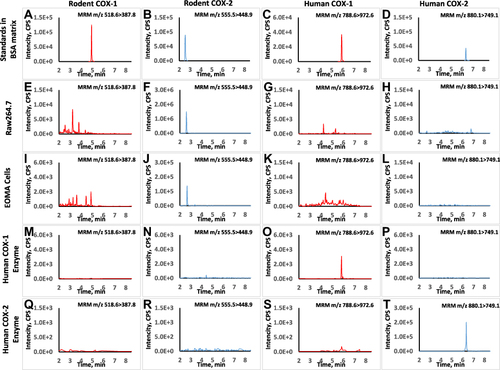
Figure 2 LC-MS method validation results in the heatmap. The newly developed LC-MS method was fully validated following the bioanalytical method validation guidelines for pharmaceutical industry released by USFDA. All inter- and intra-day accuracy and precision, recovery and standard addition accuracy were within acceptable range. Error rate = Accuracy - 100%.
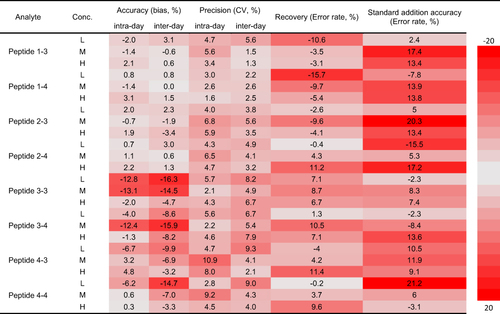
Table 1 COX-1, COX-2 and PGE2 Levels in Different Matrices.
Table 2 Relative Turnover Numbers of COX-1 and COX-2 Enzymes.
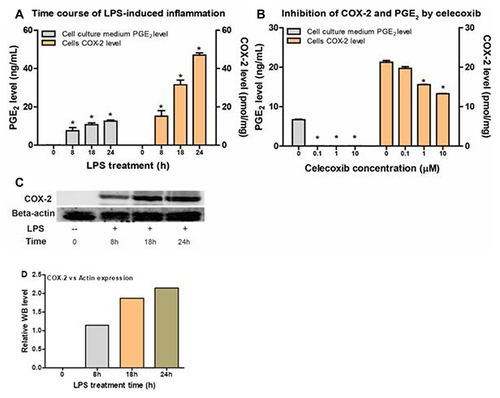
Figure 3 The correlation between PGE2 levels and COX-2 levels from Raw264.7 cells with or without LPS induction and celecoxib inhibition. (A) PGE2 production and COX-2 expression levels in Raw264.7 cells in the absence or presence of LPS for 8h, 18h and 24h. (B) PGE2 production and COX-2 expression levels in the presence of celecoxib at different concentrations (0, 0.1, 1, and 10 µM). (C) Western blot results of Raw264.7 cells with LPS stimulation at indicated time (8h, 18h and 24h). (D) WB statistical results for relative COX-2 expression level in Raw264.7 cells with LPS treatment.