Figures & data
Table 1 Basic Characteristics of the Derivation Group and the Validation Group
Table 2 Characteristics of Patients in the Derivation Group
Figure 1 (A) Comparison of BISAP score between death group and survival group; (B) comparison of TIPS score between death group and survival group; (C) comparison of BISAP score between AICU group and Non-AICU group; (D) comparison of TIPS score between AICU group and Non-AICU group; (E) comparison of BISAP score between MV group and Non-MV group; (F) comparison of TIPS score MV group and Non-MV group. All data are median (IQR) and compared using the Mann–Whitney U-test. **P < 0.05, ***P < 0.001.
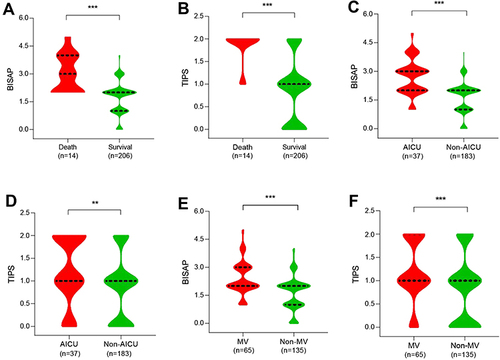
Table 3 Correlation Analysis
Table 4 Univariable and Multivariable Logistic Regression Analyses of the T-BISAP Associated with the Clinical Adverse Outcomes in Patients with AP
Table 5 ROC Curve Analysis of Predicting Prognosis of Patients with AP in the Derivation Group
Figure 2 ROC curves analysis for predicting 28-day mortality.
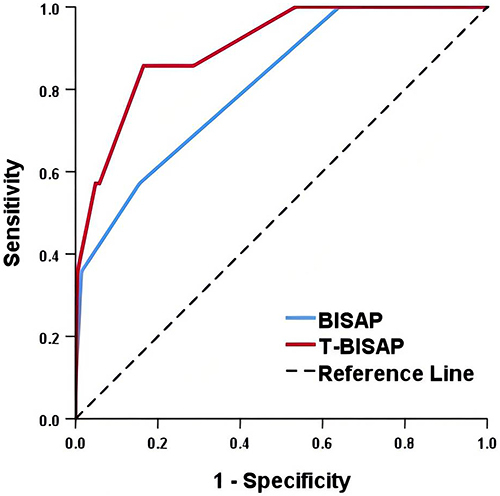
Figure 3 (A) AUCs of the prediction of 28-day mortality; (B) AUCs of the prediction of AICU; (C) AUCs of the prediction of MV.
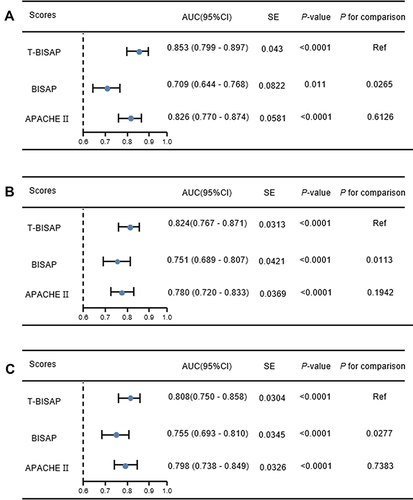
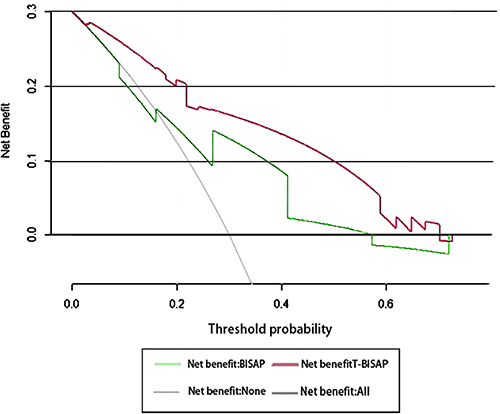
Figure 4 Decision-curve analysis (DCA) for predicting acute pancreatitis 28-day mortality. Decision curve analysis for the T-BISAP and BISAP. The x-axis shows the threshold probability, and the y-axis measures the net benefit. The red line represents the T-BISAP. The green line represents the BISAP. The thin gray line indicates the hypothesis that all patients died within 28 days. The bold black line indicates the hypothesis that no patient died within 28 days.