Figures & data
Figure 1 FMOD is upregulated and re-localized in colitis. (A) Colon biopsy samples from healthy individuals and patients diagnosed with UC were stained with H&E or subjected to immunostaining for FMOD. Representative images were captured at x20 magnification. (B) FMOD+/+ mice were given 3% DSS in drinking water for 7 days. Representative samples were H&E stained or immunostained for FMOD. Images were obtained at x20 magnification.
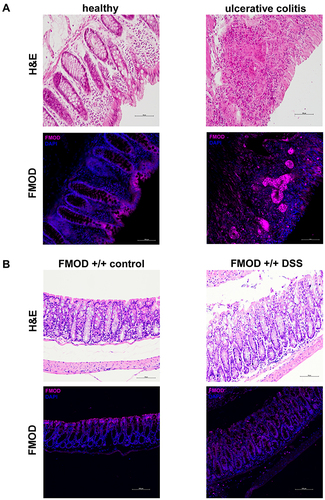
Figure 2 Ablation of FMOD facilitates DSS-related clinical signs of colitis. (A–C) FMOD+/+ (n=8) and transgenic FMOD-/- (n=10) mice were exposed to 3% DSS in drinking water for 7 days, and disease progression was monitored every day. Body weight was recorded daily (A), gross pictures of the colons were taken (B), and colon length was measured and plotted (C) on the day of sacrifice. (D) Rectal bleeding was recorded daily and scored according to the bleeding score criteria detailed in materials and methods after visually examining the anal area of treated animals. (E) DAI scores consisted of the sum of the average weight loss score, the average stool consistency score, and the average bleeding score divided by 3. Data are the mean ± SEM from two independent experiments. Statistical analysis was performed by unpaired, two-tailed t test with Welch’s correction for (D) and one-way ANOVA with Tukey’s multiple comparisons test for (A and C): *P < 0.05, **P < 0.001, ***P < 0.0001.
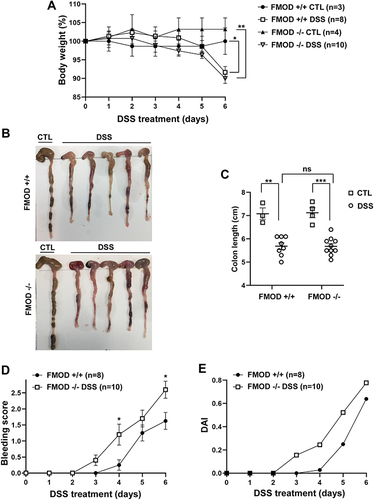
Figure 3 FMOD depletion facilitates DSS-induced pathological changes in the colon. (A) FMOD+/+ (n=8) and FMOD-/- (n=10) mice were given 3% DSS in drinking water for 7 days. Paraffin-embedded sections of the colon Swiss rolls were H&E stained. Images were obtained with x4 magnification. (B) Histological scores for the destruction of architecture (0–4), edema (0–4), ulceration (0–4), and overall score (0–3) of the full-length colon given in a blinded fashion are plotted. Data are represented as the mean ± SEM of 3 control and 8 treated FMOD+/+, and 4 control and 10 treated FMOD-/- animals. *P < 0.05 by unpaired, two-tailed t test with Welch’s correction.
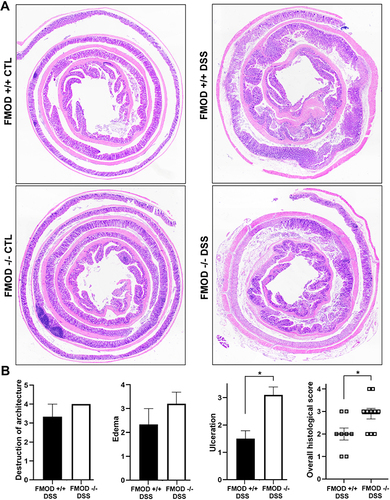
Figure 4 Knockout of FMOD amplifies the changes in expression of TJ proteins following DSS treatment. (A) Paraffin-embedded sections of DSS-treated colon Swiss rolls were stained with anti-mouse ZO-1 or claudin-1. Images were captured at x20 magnifications. (B) The graph shows the quantification of mean fluorescence intensity (MFI). (C) The transcriptional expression of TJ proteins ZO-1, claudin-1, and occludin was measured by qRT-PCR in the colon of untreated and DSS-treated FMOD+/+ and FMOD-/- mice. The graphs show quantification as fold of mRNA expression levels compared to untreated FMOD+/+ mice (n=3), mean ± SEM 3 (FMOD+/+) or 4 (FMOD-/-) control and 8 (FMOD+/+) or 10 (FMOD-/-) treated mice. (D) The claudin-1: occludin ratio was calculated using the respective mRNA expression levels. Statistical analysis was performed by unpaired, two-tailed t test with Welch’s correction: *P < 0.05, **P < 0.01.
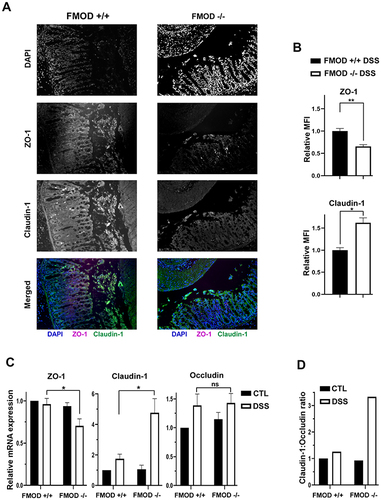
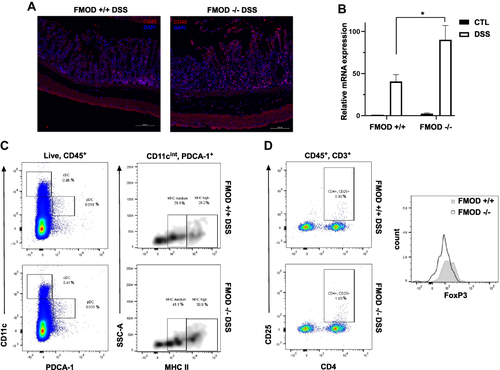
Figure 5 FMOD moderates DSS-induced colonic inflammation. (A) Paraffin-embedded sections of the DSS-treated colon Swiss rolls were stained with anti-mouse CD45. Images were captured at x20 magnifications. (B) The transcriptional expression of IFNα/β was measured by qRT-PCR in the colon. The graph shows quantification as fold of mRNA expression levels compared to untreated FMOD+/+ mice (n=3), mean ± SEM 3 (FMOD+/+) or 4 (FMOD-/-) control and 8 (FMOD+/+) or 10 (FMOD-/-) treated mice. *P<0.05 by unpaired, two-tailed t test with Welch’s correction. (C) The mesenteric lymph nodes (mLN) of DSS-treated FMOD+/+ (n=5) and FMOD-/- (n=5) mice were analyzed by flow cytometry for the frequency (left panel) and the maturity (right panel) of pDCs. Data are shown as a dot plot (frequency) or a density plot (maturity), and numbers represent the percentage of CD11cintPDCA-1+ pDCs or CD11cintPDCA-1+MHC II+ pDCs among the live CD45+ leukocytes, respectively. (D) Cells from the mLNs of treated FMOD+/+ and FMOD-/- mice were stained for the expression of CD25 and FoxP3 and analyzed by flow cytometry. Dot plots show CD25 and CD4 staining pre-gated on live CD45+CD3+ cells. The histogram represents FoxP3 staining pre-gated on live CD45+CD3+CD4+CD25+ cells.