Figures & data
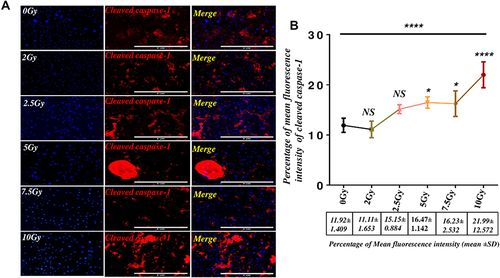
Figure 6 Gamma radiation directly activates Caspase-1 dependent pathway in microvascular endothelial cells.
Notes: (A) Immunofluorescence images of cleaved caspase −1 in microvascular endothelial cells. (B) The mean fluorescence intensity of cleaved caspase −1 in microvascular endothelial cells in the graph was relatively quantified by image J, which shows a dose-dependent increase in the expression of cleaved caspase-1. The results were representative of 6 independent experiments of four repeats (N=4) (mean ± SD) *P<0.05, ****P<0.0001 and NS.
Abbreviation: NS, not significant.