Figures & data

Figure 1 Graft components and clinical features of the 29 recipients that underwent allogeneic PBSCT. Schematic box plots representing the correlations of CD34+ cell counts and different types of DC among 29 grafts. (A) Correlation between CD34+ and CMRF44+ DC counts; (B) correlation between CMRF44+ DC and DC1 counts; (C) correlation between CMRF44D+ and DC2 counts; (D) correlation between DC1 and DC2 counts. Underlying diseases (E), cytogenetic profiles (F), and conditioning regimens (G) following allogeneic PBSCT. (H) Flowchart of PBSC-recipient outcomes. (I) Kaplan–Meier graphs of cumulative survivors free of acute GVHD and relapse 100 days after allogeneic PBSCT among subcohorts with high and low DC counts. (J) Percentage of survivors among subcohorts with high and low DC counts.
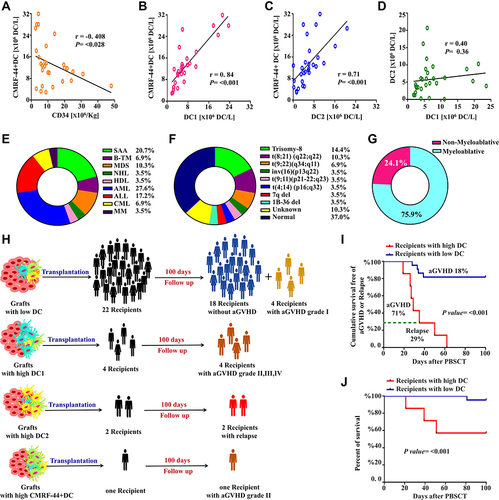
Table 1 Demographic characteristics, underlying hematologic disorders, treatment, response, cytogenetic profiles and HLA compatibility of the 29 recipients that underwent aPBSCT
Table 2 GVHD stage and grade, graft-DC components, medications, and outcomes of those who developed aGVHD
Figure 2 Comparisons between variables of graft components in group II (cases with acute GVHD) versus group I (event-free group). Total leukocyte count (A), volume of PBSC (B), total nucleated cells (C), percentage of gated cells (D), percentage (E) and count (F) of CD34+ cells, CMRF44+ DC count (G), DC1 count (H), DC2 count (I), and recipient weight (J) between group I and group II. (K) Comparison of CMRF44D+ DC and DC1 counts among patients with different grades of aGVHD. (L) Flow-cytometry analysis of DC counts in PBSC harvests for recipients (n=23) who suffered grade IV aGVHD after allogeneic PBSCT: right, increased DC counts represented by CMRF44+ DC FITC; left, increased DC1 counts represented by CD11c+ DC PE.
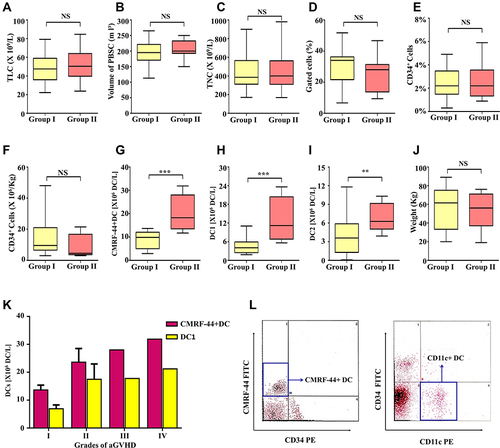
Figure 3 (A–C) Comparisons between variables of graft components in group III (cases with relapse) versus group I (event-free group). CMRF44+ DC (A), DC1 (B), and DC2 counts (C) in group I and group III. (D and E) Flow-cytometry analysis of DC counts in PBSC harvests for recipients (n=28) who suffered relapse after allogeneic PBSCT: (D) increased DCs represented by CMRF44+ DC FITC; (E) increased DC2 counts represented by CD4bright DC FITC. (F–I) Correlations of CD34+-cell and DC counts and days of hospitalization after PBSCT: CD34+ cell count (F), CMRF44+ DC count (G), DC1 count (H), DC2 count (I), and days of hospitalization after PBSCT. CD34+ cell (J) and CMRF44+ DC counts (K) in group of patients without events and complications group. (L) Percentage of survivors among group I, II, and III subcohorts.
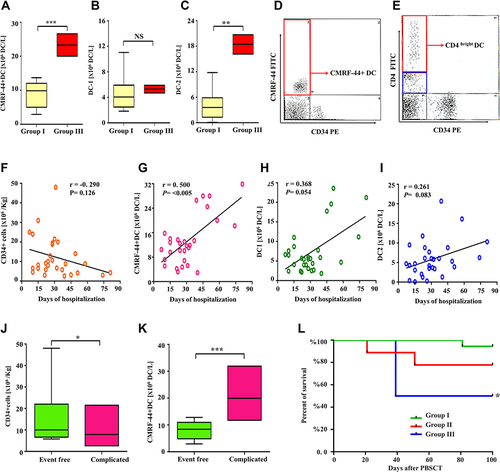
Table 3 Comparison between different variables of graft components in group II (cases with acute GVHD) versus group I (event-free group)
Table 4 Associations between DC numbers and day of myeloid and platelet engraftments in allogeneic PBSCT recipients
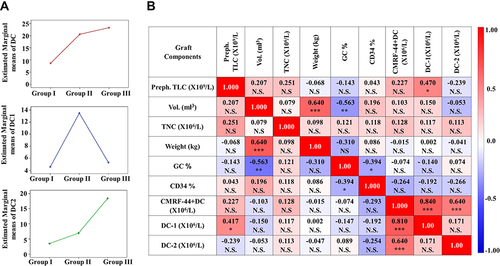
Figure 4 (A) Estimated marginal means of DCs, DC1, and DC2. (B) Matrix of correlations showing associations between variables of graft components and patient weight. Values in cells are Spearman correlation coefficients.