Figures & data
Table 1 The Base Information of Patients with PCNSL in This Study
Table 2 Plasma Th1/Th2/Th17 Cytokine Levels [Pg/mL, M (Range)]
Table 3 Plasma Th1/Th2/Th17 Cytokine Levels in 22 Patients with PCNSL in Effective Chemotherapy [Pg/mL, M (Range)]
Table 4 Plasma Th1/Th2/Th17 Cytokine Levels in 17 Patients with PCNSL in Ineffective Chemotherapy [Pg/mL, M (Range)]
Figure 1 Distribution of IL-2 and IFN-α in patients with PCNSL and the control group.
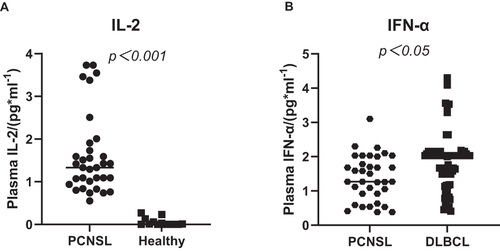
Figure 2 Comparison of IL-2 between initial and after treatment in patients with PCNSL.
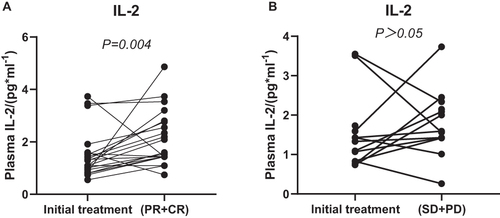
Table 5 Levels of Lymphocyte Subsets at Initial Treatment [%, M (Range)]
Table 6 Levels of Lymphocyte Subsets in 22 Patients with PCNSL in Effective Chemotherapy [%, M(Range)]
Table 7 Levels of Lymphocyte Subsets in 17 Patients with PCNSL in Ineffective Chemotherapy [%, M(Range)]
Figure 3 Distribution of Treg, CD3+, CD4+, CD8+, CD4/CD8, and CD19+ cells in patients with PCNSL and the control group.
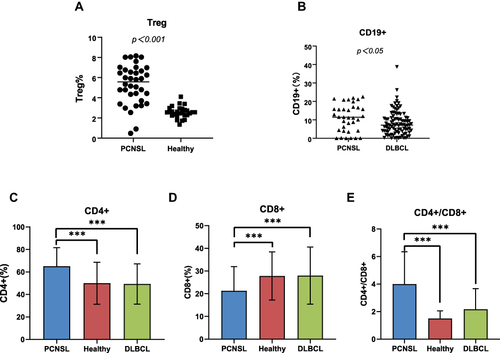
Figure 4 Comparison of CD19+, CD3+, CD8+, CD4+/CD8+ between initial and after treatment in patients with PCNSL.
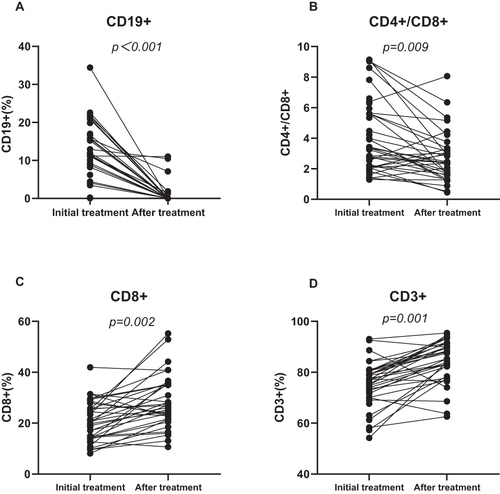
Table 8 Analysis of Prognostic Factors
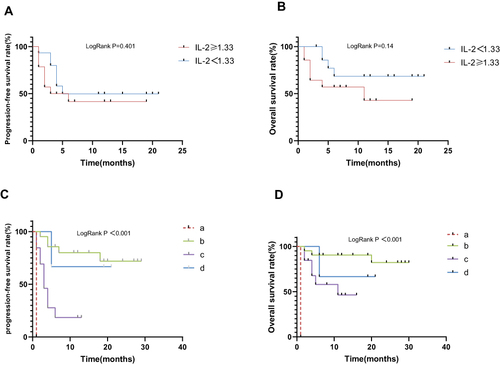
Figure 5 Kaplan–Meier curves for progression-free and overall survival of all patients with PCNSL.
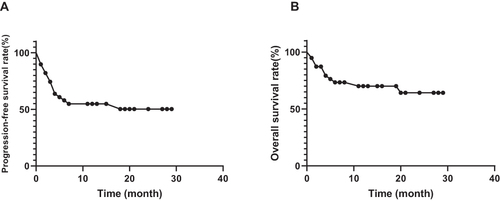
Figure 6 Kaplan–Meier curves for progression-free and overall survival of all newly diagnosed patients with PCNSL.