Figures & data
Figure 1 Flowchart of the study procedures.
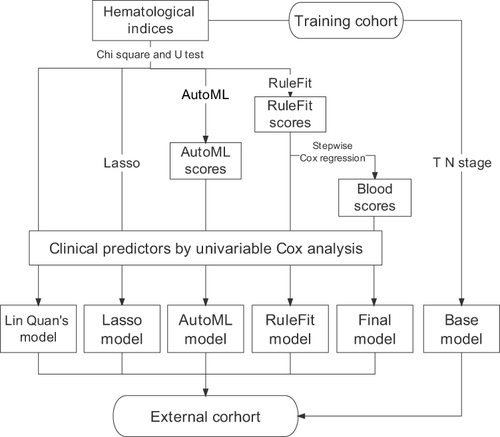
Table 1 Clinical Characteristics of Patients in the Primary and Validation Cohorts
Table 2 C-Index of Different Modules in the Primary and Validation Cohorts
Figure 2 Nomogram of final model.
Abbreviations: OS, overall survival; EBV, Epstein-Barr virus.
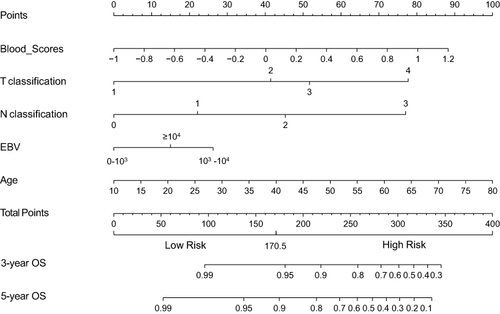
Figure 3 Decision curve analysis of the 5-year overall survival predictions.
Notes: Horizontal and axis represent the mortality risk and net benefit, respectively. The curves of models are above on lines of extreme assumptions, indicating the net benefit.
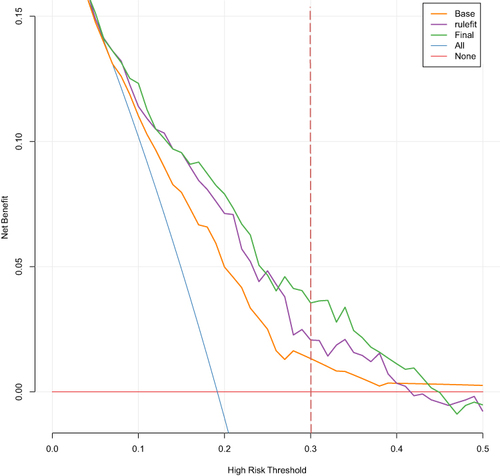
Figure 4 Risk stratification in final model and AJCC stage.
Notes: AJCC stage I, II were thought low-risk and III, IV stage were high-risk. (A and D) groups represent patients with same high- or low-risk stratification in AJCC stage and final model. (B) group was predicted low risk by final model but high risk by AJCC, and C group was predicted high risk by final model but low risk by AJCC.
Abbreviations: OS, overall survival; AJCC, American Joint Cancer Committee.
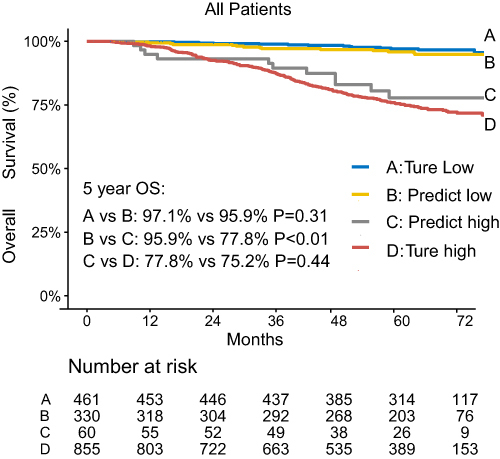
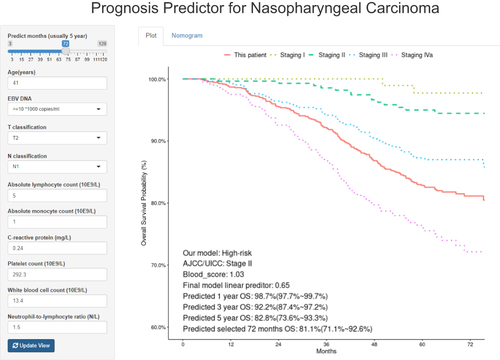
Figure 5 A case of NPC patients using the network-based predictor for prognosis predicting.
Notes: Overall survival was set as the endpoint in app. Detailed instruction for replicated blood scores calculation was uploaded here to facilitate clinical and patient usage (https://github.com/trackse/bloodscore).
Abbreviations: OS, overall survival; EBV, Epstein-Barr virus.