Figures & data
Figure 1 Experimental protocol of in vivo and in vitro experiments. (A) Time profiling of in vivo and in vitro experiments; (B) Number of experimental animal in each test group; (C) Different tests for HT-22 cells and BV-2 cells after administrated with 1 g/L, 2 g/L, and 4 g/L modified citrus pectin; (D) The co-culture design of HT-22 cells with the supernatant of BV-2 cells. CCK-8 indicates cell counting kit 8; FJB, Fluoro-Jade B; LDH, lactate dehydrogenase; MCAO, middle cerebral artery occlusion; OGD, oxygen-glucose deprivation; TTC, 2,3,5-triphenyltetrazolium chloride; TUNEL, terminal-deoxynucleotidyl transferase mediated nick end labeling.
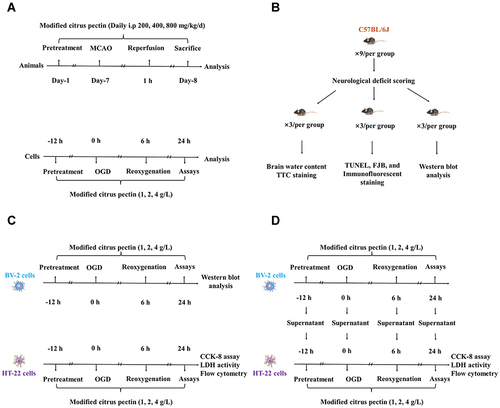
Figure 2 MCP treatment protected against cerebral ischemia/reperfusion injury in C57BL/6J mice at 1 day after MCAO/R operation. (A) Neurological deficit score test, n=9 per group; (B) Brain water content measurement, n=3 per group; (C) Cerebral infarction size measurement, n=3 per group; (D) Representative TTC (2,3,5-triphenyltetrazolium chloride) staining images, n=3 per group. MCAO/R indicates middle cerebral artery occlusion/reperfusion; MCP, modified citrus pectin. Data are mean ± standard deviation.
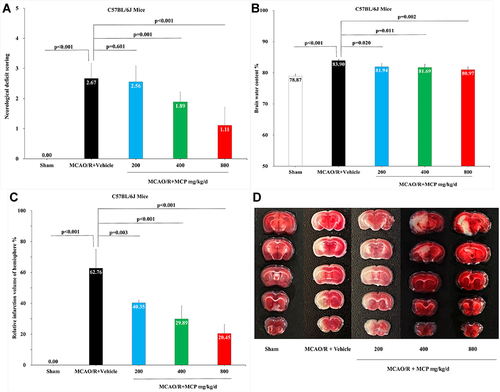
Figure 3 MCP attenuated neuronal injury and apoptosis in C57BL/6J mice at 1 day after MCAO/R operation. (A) Representative TUNEL (Terminal-deoxynucleotidyl Transferase Mediated Nick End Labeling) staining images of cerebral apoptotic cells, counterstained with DAPI and Representative FJB (Fluoro-Jade B) staining images of cerebral injured cells, n=3 per group, scale bar: 50μm. (B) Quantification of merged cells in the ischemic penumbra of cerebral cortex. (C) Quantification of merged cells in the ischemic penumbra of cerebral cortex. MCAO/R indicates middle cerebral artery occlusion/reperfusion; MCP, modified citrus pectin. Data are mean ± standard deviation.
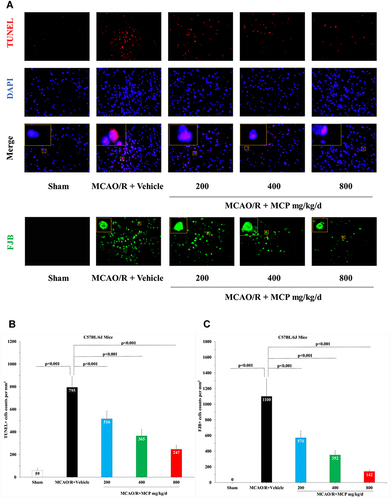
Figure 4 MCP attenuated neuronal cell viability and injury in OGD/R model. (A) Neuronal cell (HT-22) viability after OGD/R was assessed by CCK-8 tests. (B) Neuronal cell (HT-22) viability after OGD/R was assessed by CCK-8 tests, when co-cultured with supernatant of BV-2 cells. (C) Neuronal cell (HT-22) injury after OGD/R was assessed by LDH activity. (D) Neuronal cell (HT-22) viability after OGD/R was assessed by LDH activity, when co-cultured with supernatant of BV-2 cells. MCP indicates modified citrus pectin, OGD/R, oxygen-glucose deprivation/reperfusion. Data are mean ± standard deviation, and n=5 per group.
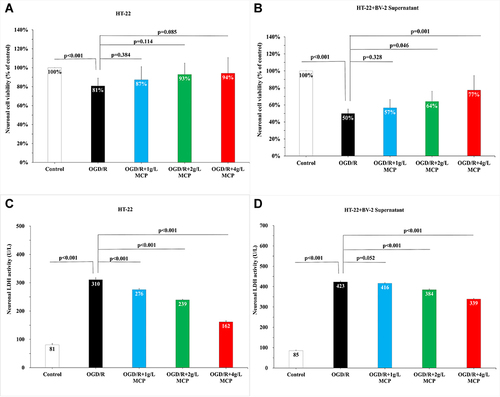
Figure 5 MCP attenuated neuronal cell apoptosis in OGD/R model. (A) Neuronal cell (HT-22) apoptosis after OGD/R was assessed by flow cytometry. (B) Representative flow cytometry images of neuronal cell (HT-22) apoptosis. (C) Representative flow cytometry images of neuronal cell (HT-22) apoptosis, when co-cultured with supernatant of BV-2 cells. MCP indicates modified citrus pectin, OGD/R, oxygen-glucose deprivation/reperfusion. Data are mean ± standard deviation, and n=5 per group.
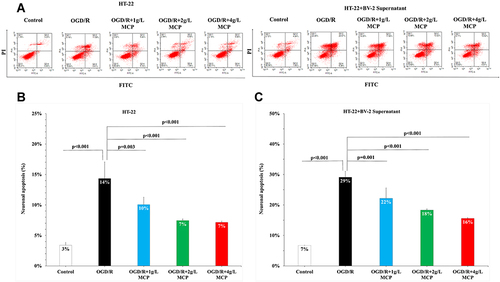
Figure 6 MCP treatment reduced the co-expression of NLRP3 inflammasome and microglia in C57BL/6J mice at 1 day after MCAO/R operation. (A) Representative double immunofluorescence staining images of cerebral cortex with NLRP3 (green) and Iba1 (microglia, red), counterstained with DAPI, n=3 per group, scale bar: 50μm. (B) Quantification of merged cells in the ischemic penumbra. MCAO/R indicates middle cerebral artery occlusion/reperfusion; MCP, modified citrus pectin; NLRP3, NOD-like receptor 3. Data are mean ± standard deviation, and n=3 per group.
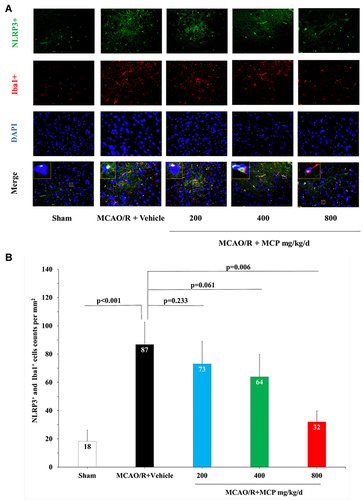
Figure 7 The effects of MCP on NLRP3 inflammasome, cleaved-caspase-1/caspase-1, and IL-1β in cerebral cortex after MCAO/R injury. Western blot analysis showed that MCP treatment reduced the expression of NLRP3 inflammasome, cleaved-caspase-1, and IL-1β in C57BL/6J mice at 1 day after MCAO/R operation. Proteins had been normalized to β-actin. MCAO/R indicates middle cerebral artery occlusion/reperfusion; MCP, modified citrus pectin; NLRP3, NOD-like receptor 3. Data are mean ± standard deviation, and n=3 per group.
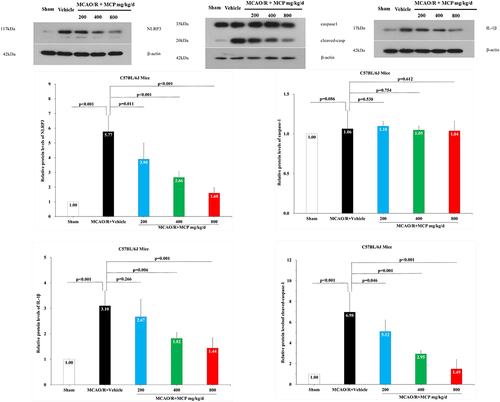
Figure 8 The effects of MCP on NLRP3 inflammasome, cleaved-caspase-1/caspase-1, and IL-1β in microglial cells (BV-2) after OGD/R injury. Western blot analysis showed that MCP treatment reduced the expression of NLRP3 inflammasome, cleaved-caspase-1, and IL-1β in BV-2 cells after OGD/R operation. Proteins had been normalized to β-actin. OGD/R indicates oxygen-glucose deprivation/reperfusion; MCP, modified citrus pectin, NLRP3, NOD-like receptor 3. Data are mean ± standard deviation, and n=5 per group.
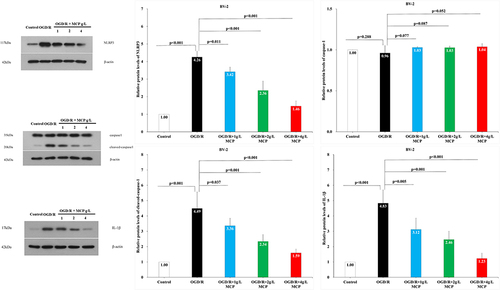
Figure 9 MCP treatment reduced the co-expression of galectin-3 and microglia, and TLR4, NF-κBp65 in C57BL/6J mice at 1 day after MCAO/R operation. (A) Representative double immunofluorescence staining images of cerebral cortex with galectin-3 (green) and Iba1 (microglia, red), counterstained with DAPI, n=3 per group, scale bar: 50μm. (B) Quantification of merged cells in the ischemic penumbra. Data are mean ± standard deviation.
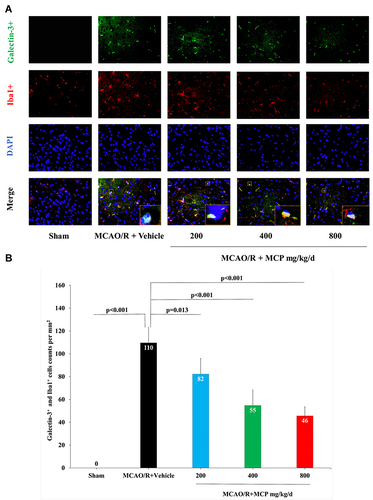
Figure 10 The effects of MCP on TLR4, NF-κBp65, and galectin-3 in cerebral cortex after MCAO/R injury. Western blot analysis showed that MCP treatment reduced the expression of TLR4, NF-κBp65, and galectin-3 in C57BL/6J mice at 1 day after MCAO/R operation. Proteins had been normalized to β-actin. MCAO/R indicates middle cerebral artery occlusion/reperfusion; MCP, modified citrus pectin. Data are mean ± standard deviation, and n=3 per group.
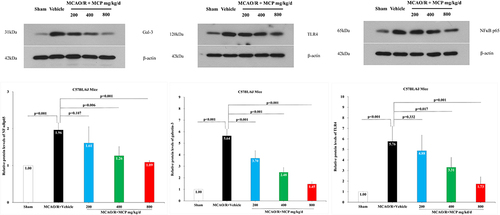
Figure 11 The effects of MCP on TLR4, NF-κBp65, and galectin-3 in microglial cells (BV-2) after OGD/R injury. Western blot analysis showed that MCP treatment reduced the expression of TLR4, NF-κBp65, and galectin-3 in BV-2 cells after OGD/R operation. Proteins had been normalized to β-actin. OGD/R indicates oxygen-glucose deprivation/reperfusion; MCP, modified citrus pectin. Data are mean ± standard deviation, and n=5 per group.
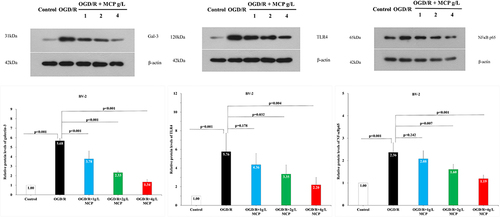
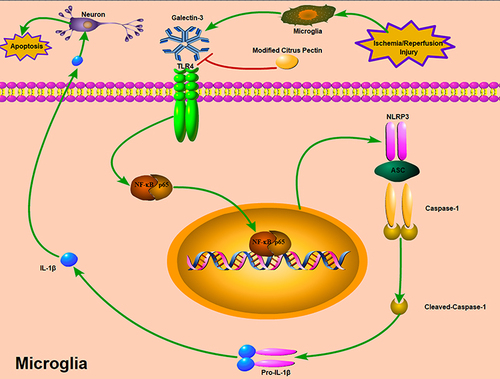
Figure 12 Potential mechanisms by which MCP protects against cerebral ischemia/reperfusion injury. MCP indicates modified citrus pectin. Cerebral ischemic insult may promote the expression of galectin-3 in microglia, and then trigger the activation of NLRP3 inflammasome in microglia through TLR4/NF-κB signaling pathway, which converts caspase-1 into cleaved-caspase-1. Cleaved-caspase-1 further converts pro-IL-1β into IL-1β, which is then secreted into the extracellular space and contributes to secondary inflammatory response. The neuroprotective effects of MCP on anti-inflammation through blocking expression of galectin-3 was mediated by the axis of TLR4/NF-κB/NLRP3/cleaved-caspase-1/IL-1β in microglia.