Figures & data
Figure 1 The flow diagram of selection of eligible LA-ESCC patients who received nICT followed by radical resection. Based on the inclusion and exclusion criteria, a total of 285 patients were randomly divided into two groups (training set, n=200 and validation set, n=85).
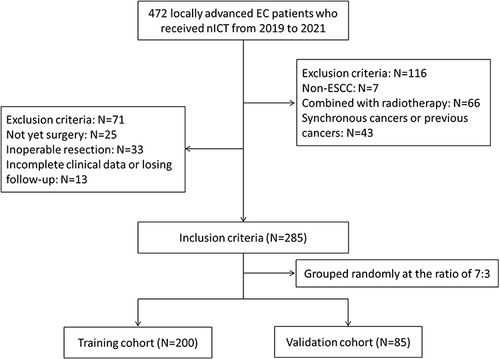
Table 1 Comparison of the Baseline Characteristics in the Training and Validation Cohorts
Figure 2 Process diagram for IINS construction and risk stratification. According to the LASSO logistic regression model, 8 indicators out of 18 variables including BMI, NEUT, NLR, LMR, HB, CAR, PLT and HALP were selected to construction IINS.
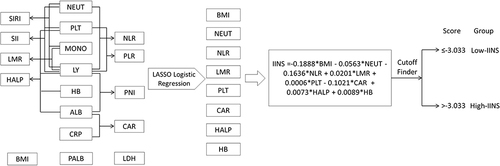
Figure 3 Construction of IINS by using LASSO logistic regression model and AUC comparisons between IINS and other variables. (A) A correlation matrix is represented regarding 18 indicators. (B) LASSO coefficient profiles of the 18 indicators. (C) Ten-fold cross‐validation for tuning parameter selection in the LASSO model.
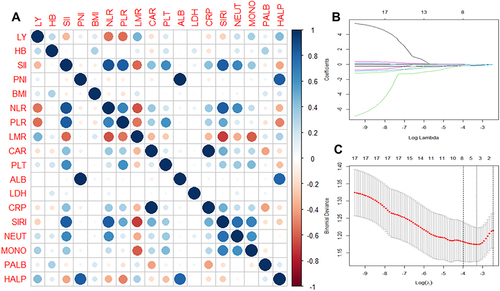
Figure 4 The optimal cutoff value achieved for IINS. (A) Distribution for IINS based cutoff optimization. (B) Cutoff optimization by correlation with pCR prediction. The vertical line denotes the optimal cutoff point, which was generated by Cutoff Finder. (C) ROC for IINS. A score of −3.033 was chosen as the cutoff point representing the optimal balance between sensitivity (67.2%) and specificity (66.9%). (D) Waterfall plot for IINS. Biologically effective dose values were stratified with the optimal threshold obtained.
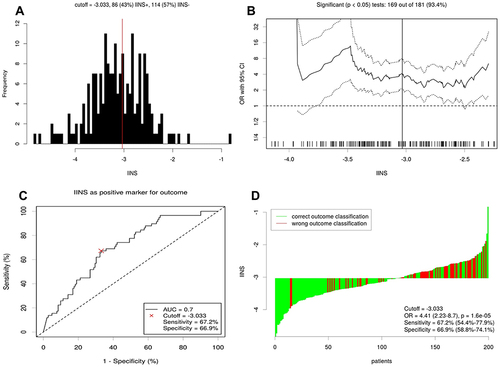
Table 2 Comparison of Baseline Characteristics Based on IINS in Training and Validation Sets
Figure 5 The violin plots and histograms regarding IINS. The violin plots regarding IINS values grouped by pCR in the (A) training and (B) validation cohort. The histograms regarding pCR rate grouped by pCR in the (C) training and (D) validation set.
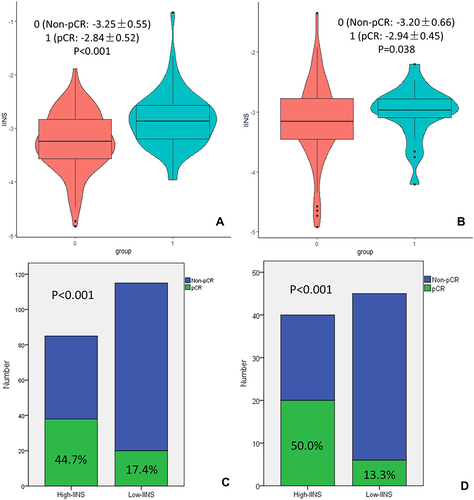
Table 3 Logistic Univariate Analysis of Predictors for pCR in Training Cohort
Table 4 Logistic Multivariate Analysis of Predictors for pCR in Training Cohort
Figure 6 ROC curves for pCR prediction between IINS and BMI. Based on the ROC curves in (A) total set, (B) training set and (C) validation set, IINS had a larger AUC than BMI, indicating a higher pCR predictive ability of IINS than BMI.
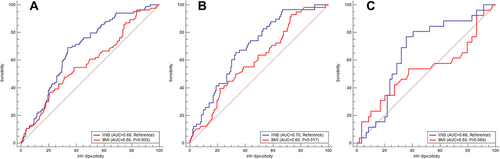
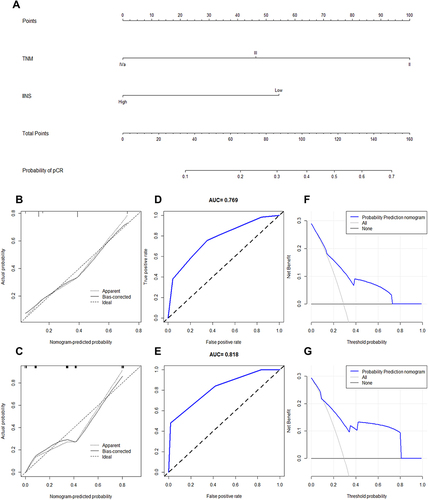
Figure 7 Nomogram established based on IINS and valeted. (A) A nomogram based on IINS and TNM was established to predict pCR. Calibration of the nomogram used to predict pCR after nICT in the (B) training and (C) validation cohort. ROC indicated an acceptable agreement regarding pCR prediction in the (D) training and (E) validation cohort. The DCA indicated a good clinical applicability of the model in predicting the probability of pCR in the (F) training and (G) validation cohort.