Figures & data
Figure 1 C16+Ang-1 alleviated functional impairment. Mice were treated with MPTP to establish the PD model. Mice were treated with either C16+Ang-1, levodopa, or C+A+L. Motor and cognitive function were assessed. (A and B) The total distance travelled (A) and the mean velocity (B) of mice in each group in the open field test. (C) The average pole climbing time in the pole climbing test. (D) Time staying on the device in the rotarod test. (E) Average grip strength of forepaws. (F) Discrimination scores (%) in the NOR test. a, P < 0.05 versus control; b, P < 0.05 versus vehicle; c, P < 0.05 versus C16+Ang-1 group; d, P < 0.05 versus levodopa group.
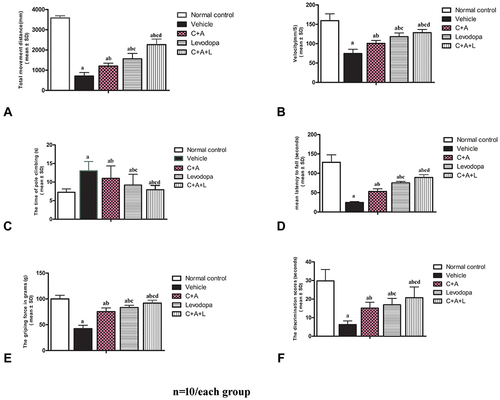
Figure 2 C16+Ang-1 and C+A+L alleviated muscle synchronous contraction. Wave amplitude (uV) was measured. (A) control; (B) MPTP; (C) MPTP and C16+Ang-1; (D) MPTP injection and levodopa; (E) MPTP and C+A+L; (F) synchronous contraction amplitude of extensor/flexor in each group. a, P < 0.05 versus control; b, P < 0.05 versus vehicle group; c, P < 0.05 versus C16+Ang-1 treated group; d, P < 0.05 versus levodopa-treated group.
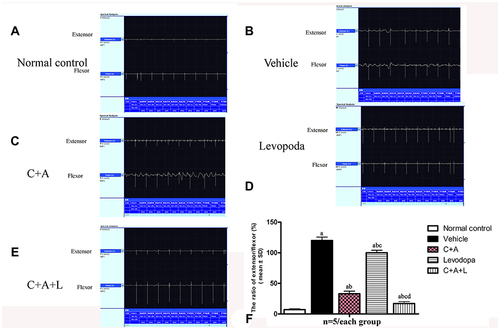
Figure 3 C16+Ang-1 treatment alleviated inflammation. (A–D): IL-6 (A), TNF-α (B), ROS (C), IL-10 (D), and γ-GABA (E) were measured a, P < 0.05 versus control; b, P < 0.05 versus vehicle group; c, P < 0.05 versus C16+Ang-1 treated group; d, P < 0.05 versus levodopa-treated group.
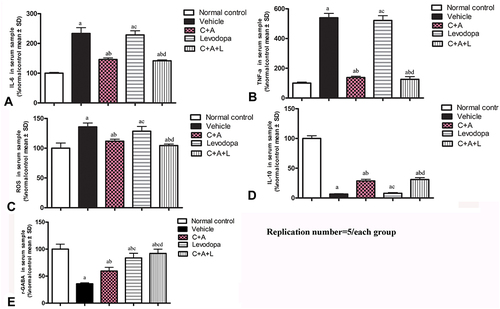
Figure 4 (A–J) CD3 and Nissel immunostaining. (A–E) CD3 immunostaining (green); (F–J) Nissel staining. (A and F) control; (B and G) MPTP, arrow in G denoted “perivascular cuffing” of inflammatory cells infiltration. (C and H) MPTP and C16+Ang-1; (D and I) MPTP and levodopa; (E and J) MPTP and C+A+L; (K–O) C16+Ang-1 treatment suppressed activated astrocytes as indicated by Iba-1 immunostaining. Iba-1 immunostaining (green) in the corpus striatum is shown. (K) control; (L) MPTP; (M) MPTP and C16+Ang-1; (N) MPTP and levodopa; (O) MPTP and C+A+L; (P–T): C16+Ang-1 suppressed activated astrocytes as indicated by GFAP immunostaining. (P) control; (Q) MPTP, arrow showed the reactive astrogliosis forms glia scar; (R) MPTP and C16+Ang-1; (S) MPTP and levodopa; (T) MPTP and C+A+L; (U–Y) Detection of LRRK2 using immunofluorescence. IRRK2 (green) in the corpus striatum is shown. (U) control; (V) MPTP; (W) MPTP and C16+Ang-1; (X) MPTP and levodopa; (Y) MPTP and C+A+L; (I–IV): Quantification of inflammatory scores (I), Iba-1+ cells (II), GFAP+ cells (III) and IRRK2+ cells (IV). a, P < 0.05 versus control; b, P < 0.05 versus vehicle group; c, P < 0.05 versus C16+Ang-1 treated group; d, P < 0.05 versus levodopa-treated group. Inflammatory scores:0, without inflammation; 1, limited cellular infiltration around blood vessels and meninges; 2, mild infiltration (1–10 inflammatory cells/slide in parenchymal tissues); 3, moderate infiltration (11–100 inflammatory cells/slide in parenchymal tissues); 4, severe infiltration (> 100 inflammatory cells/slide in parenchymal tissues).
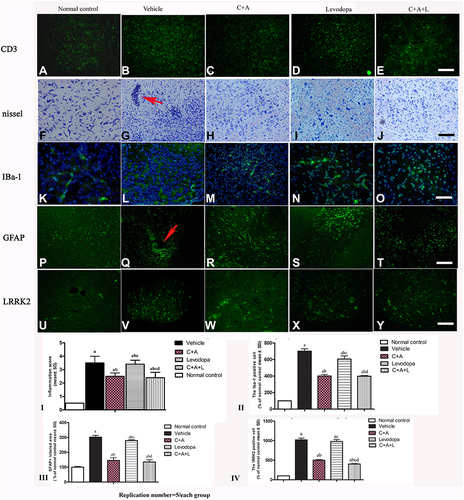
Figure 5 Expression of CD3 (A and B), Iba-1 (C and D), Lrrk2 (E and F), GFAP (G and H), and ZO-1 (I and J) by Western blot analysis. a, P < 0.05 versus control; b, P < 0.05 versus vehicle group; c, P < 0.05 versus C16+Ang-1 treated group; d, P < 0.05 versus levodopa-treated group.
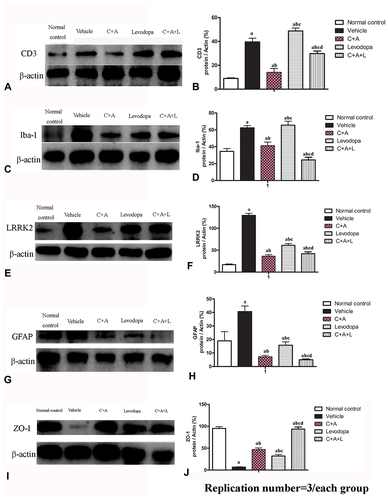
Figure 6 (A–E) C16+Ang-1, but not levodopa, reduced BBB permeability and blood vessel leakage. EB leakage showed by red colour. (F–J) Tight junction between microvascular endothelial cells, shown by immunofluorescence staining of ZO-1 (green), were reduced in the vehicle group, but maintained by C16+Ang-1 treatment. (K) Quantification of EB. (L) Quantification of ZO-1. Scale bar = 100 µm. a, P < 0.05 versus control; b, P < 0.05 versus vehicle group; c, P < 0.05 versus C16+Ang-1 treated group; d, P < 0.05 versus levodopa-treated group.
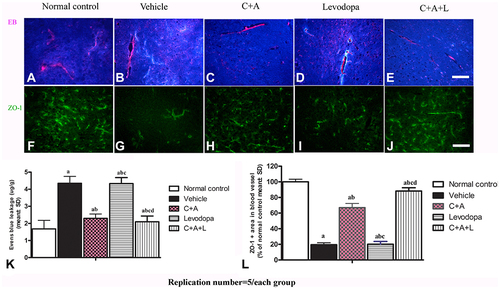
Figure 7 (A–J) Nissl staining of the SN and striatum. Neuronal loss is shown in the SN (A–E) and striatum (F–J). (K–O) Expression of active caspase-3 in (K) control; (L) MPTP; (M) MPTP and C16+Ang-1; (N) MPTP and levodopa; (O) MPTP and C+A+L; (P) The number of surviving neural cells was normalized to control. (Q) Quantification of caspase 3-labeled cells. Scale bar = 100 µm. a, P < 0.05 versus control; b, P < 0.05 versus vehicle group; c, P < 0.05 versus C16+Ang-1 treated group; d, P < 0.05 versus levodopa-treated group.
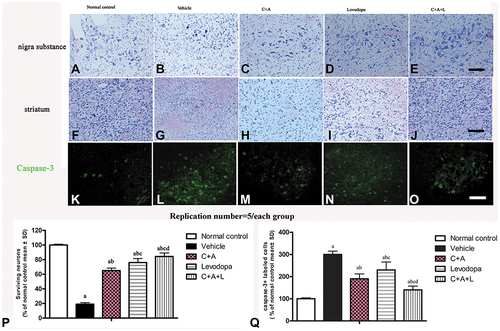
Figure 8 (A–J) Expression of TH in the SN and striatum. (A and F) control; (B and G) MPTP; (C and H) MPTP and C16+Ang-1; (D and I) MPTP and levodopa; (E and J) MPTP and C+A+L; (K–O) Expression of Syn in the striatum. Staining of Syn (green) in the striatum, (K) control; (L) MPTP; (M) MPTP and C16+Ang-1; (N) MPTP and levodopa; (O) MPTP and C+A+L; (P–T) Expression of GAT-1 in the nigra substance. (P) control; (Q) MPTP; (R) MPTP and C16+Ang-1; (S) MPTP and levodopa; (T) MPTP and C+A+L; (U–Y) Expression of ACHE in the striatum. (U) control; (V) MPTP; (W) MPTP and C16+Ang-1; (X) MPTP and levodopa; (Y) MPTP and C+A+L; Scale bar = 100 µm. (I–V) quantification of TH+ cells in the SN (I), TH+ fibers in the striatum (II), Quantification of Syn+ area (III), quantification of GAT-1+ cells (IV), and quantification of ACHE+ cells (V).a, P < 0.05 versus control; b, P < 0.05 versus vehicle group; c, P < 0.05 versus C16+Ang-1 treated group; d, P < 0.05 versus levodopa-treated group.
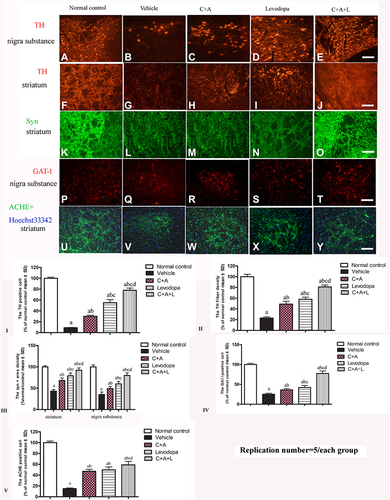
Figure 9 Expression of active caspase-3 (A and B), TH (C and D), Syn (E and F), GAT-1 (G and H), and ACHE (I and J) were measured using Western blot analysis. a, P < 0.05 versus control; b, P < 0.05 versus vehicle group; c, P < 0.05 versus C16+Ang-1 treated group; d, P < 0.05 versus levodopa-treated group.
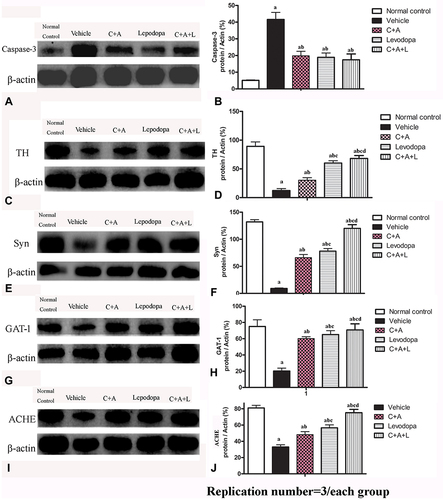
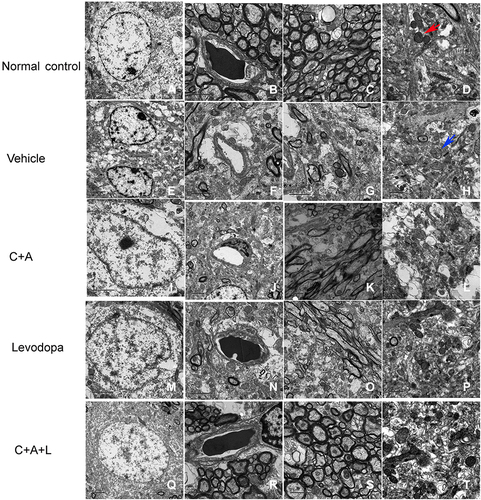
Figure 10 Ultrastructural morphology using TEM. (A–D) control; (E–H) MPTP; (I–L) MPTP and C16+Ang-1; (M–P) MPTP and levodopa; (Q–T) MPTP and C+A+L. Mitochondria with clear cristae are shown by the red arrow. Mitochondria vacuolization and swollen cristae are shown by the blue arrow. A-C, E-G, I-K, M-O, Q-S, Scale bar = 2 μm; D, H, L, P, T, Scale bar = 1 μm.