Figures & data
Table 1 Characteristics of the Expression Profiles in This Study
Figure 1 Flow diagram for the identification of immune-related circRNA biomarkers in AIS. (A) DECs, DEMs, DEIRGS were obtained from three different GEO datasets and two publicly accessible databases, and were analyzed by “limma” R package. The ceRNA pairs were predicted using Circbank and Mirwalk online databases, then constructed the ceRNA network. Identification the hub genes of the ceRNA network by centiscape algorithm and were further constructed the sub ceRNA network. The six highly expressed circRNAs were chosen as candidates for further investigation. (B) These six candidate circRNAs analyzed by qPCR and ROC curves in validation sample for functional validation. Finally, two circRNAs biomarkers were used to test the predictive accuracy in replication sample.
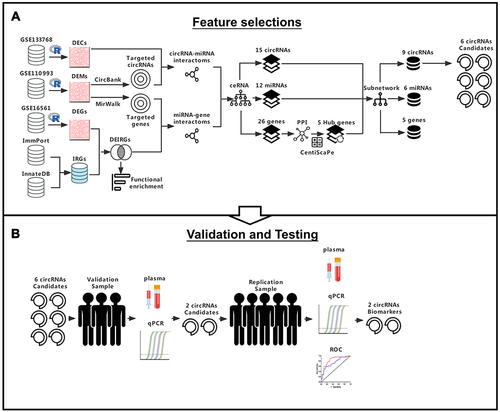
Figure 2 Screening and identification of DEGs, DEMs, DECs and DEIRGs in AIS patients and HCs. The volcano plot of DEGs (A), DEMs (C), DECs (E) in GSE16561, GSE110993, and GSE133768, respectively. Red dots represent upregulation while blue dots represent downregulation. The hierarchical cluster heatmaps of DEGs (B), DEMs (D), DECs (F) in GSE16561, GSE110993, and GSE133768, respectively. Orange red represents high expression while blue represents low expression. (G) Venn diagram of DEGs and IRGs. Purple and blue circles represent DEGs and IRGs, respectively, and their overlap region represents DEIRGs.
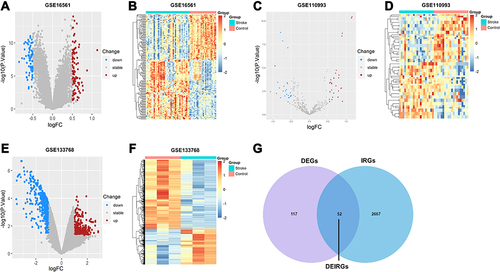
Figure 3 Functional enrichment analysis for DEIRGs. (A) Top 15 significantly enriched GO terms for biological process (BP), cellular component (CC), and molecular function (MF). The color scale from blue to red indicates the gradual increase of the level of enrichment. (B) KEGG pathway enrichment analyses of DEIRGs. The color scale from blue to red indicates the gradual increase of the level of enrichment. Each circle indicates a specific KEGG pathway terms and circle size represents the number of genes that have been enriched.
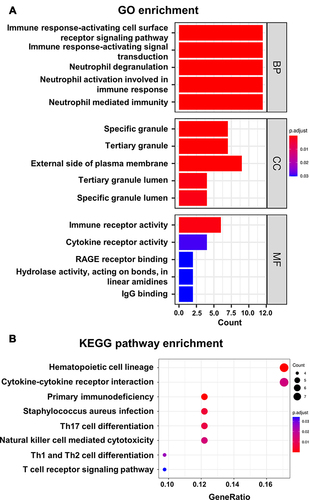
Figure 4 Construction of the dysregulated AISIRC network in AIS. Red and green triangles represent upregulated circRNAs and downregulated circRNAs, respectively. Orange and blue rectangles represent upregulated miRNAs and downregulated miRNAs, respectively. Yellow and purple ovals represent upregulated genes and downregulated genes, respectively. Gray lines represent the interactions between the parts of AISIRC network.
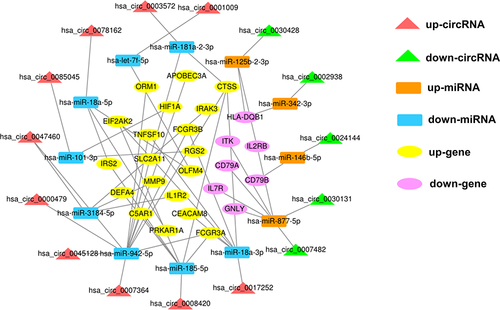
Table 2 Five Hub Genes Identified by Centiscape 2.2
Figure 5 Construction of the PPI network and the circRNA–miRNA–hub gene subnetwork. (A) PPI network of DEIRGs in the AISIRC network. Node size is proportional to their degree in the PPI network, and edge thickness is proportional to the combined score between DEIRGs. The five important hub genes (dark orange nodes) were identified from the PPI network using the Centiscape algorithm. (B) Subnetworks of these five hub genes extracted from the AISIRC network. Red and green triangles represent upregulated circRNAs and downregulated circRNAs, respectively. Orange and blue rectangles represent upregulated miRNAs and downregulated miRNAs, respectively. Yellow and purple ovals represent upregulated genes and downregulated genes, respectively. Gray lines represent the interactions between the parts of AISIRC network.
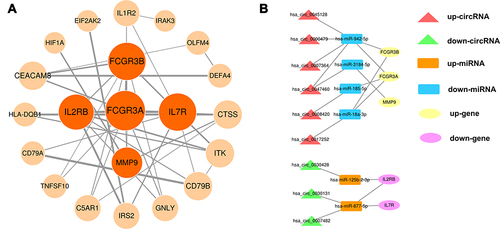
Table 3 Baseline Characteristics of the Validation and Replication Sample
Figure 6 Relative levels of the five candidate circRNAs via qRT-PCR in the validation sample (n=36/36, healthy control [HC]/acute ischemic stroke [AIS]). Two circRNAs were significantly differentially expressed: (A) hsa_circ_0007364 and (E) hsa_circ_0045128. Three circRNAs were not significantly differentially expressed: (B) hsa_circ_0000479, (C) hsa_circ_0047460, and (D) hsa_circ_0017252. Median ± interquartile range, Mann–Whitney U-test.
![Figure 6 Relative levels of the five candidate circRNAs via qRT-PCR in the validation sample (n=36/36, healthy control [HC]/acute ischemic stroke [AIS]). Two circRNAs were significantly differentially expressed: (A) hsa_circ_0007364 and (E) hsa_circ_0045128. Three circRNAs were not significantly differentially expressed: (B) hsa_circ_0000479, (C) hsa_circ_0047460, and (D) hsa_circ_0017252. Median ± interquartile range, Mann–Whitney U-test.](/cms/asset/af3e6f78-905d-49b9-aca9-cb00b9c98be1/djir_a_12199683_f0006_c.jpg)
Figure 7 Relative levels of (A) circPTP4A2 and (B) circTLK2 via qRT-PCR in the replication sample (n=100/66/200, healthy control [HC]/transient ischemic attack [TIA]/acute ischemic stroke [AIS]). Median ± interquartile range, Kruskal–Wallis ANOVA test followed by Bonferroni correction pairwise comparisons. *P < 0.05; **P < 0.01; ***P < 0.001.
![Figure 7 Relative levels of (A) circPTP4A2 and (B) circTLK2 via qRT-PCR in the replication sample (n=100/66/200, healthy control [HC]/transient ischemic attack [TIA]/acute ischemic stroke [AIS]). Median ± interquartile range, Kruskal–Wallis ANOVA test followed by Bonferroni correction pairwise comparisons. *P < 0.05; **P < 0.01; ***P < 0.001.](/cms/asset/ed202e48-9b1c-4276-8633-b53a9c6a2222/djir_a_12199683_f0007_c.jpg)
Table 4 Logistic Regression Analysis for Predictive Power of circPTP4A2 and circTLK2
Table 5 Diagnostic Property of Individual circRNAs and the Combined circRNAs
Figure 8 Diagnostic property of individual circRNAs and the combined circRNAs. Receiver operating characteristics (ROC) curves were calculated using the baseline levels of circRNAs based on the replication sample and their corresponding AUC values for discriminating AIS patients from HCs (A), for discriminating AIS patients from TIA patients (B), and for discriminating TIA patients from HCs (C).
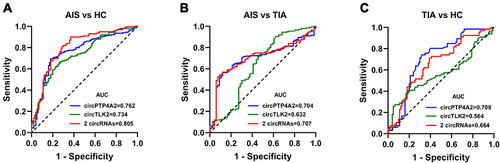
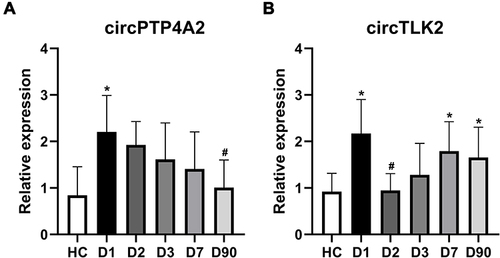
Figure 9 Temporal expression profile of validated circRNAs after AIS. The results for 18 patients with available data for five time points after AIS: circPTP4A2 (A) and circTLK2 (B). Median ± interquartile range, Kruskal–Wallis ANOVA test followed by Bonferroni correction pairwise comparisons. *P<0.05 compared with HC; #P<0.05 compared with day 1.