Figures & data
Figure 1 DEPDC1B expression in lung adenocarcinoma (LUAD). (A) DEPDC1B expression levels in LUAD and normal tissues from a TCGA dataset. (B) DEPDC1B expression levels in LUAD and paired normal tissues from a TCGA dataset. (C) Immunohistochemical staining of DEPDC1B in LUAD and adjacent normal lung tissues from 100 patients. Representative IHC images of DEPDC1B expression in normal tissues (D) and LUAD tissues (E).
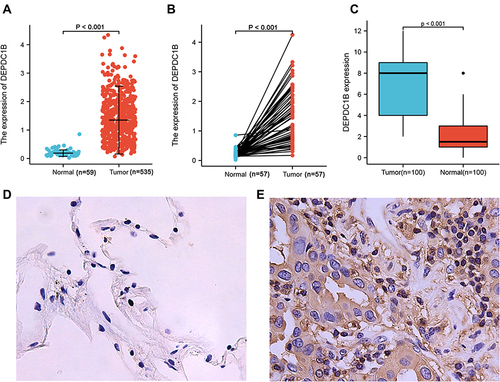
Figure 2 Association of DEPDC1B expression with clinicopathologic characteristics in lung adenocarcinoma (LUAD): (A) T stage, (B) N stage, (C) primary therapy outcome, (D) pathologic stage, (E) gender, (F) age, and (G) smoker.
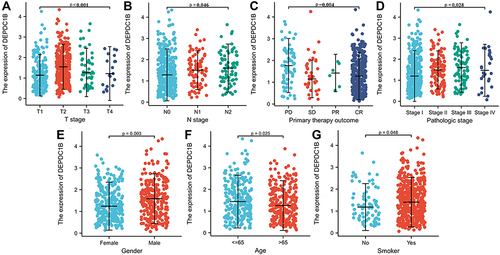
Figure 3 Kaplan-Meier survival curves comparing patients with high and low DEPDC1B-expressing LUAD from a TCGA dataset. (A) Overall survival and (B) progression free interval. Kaplan–Meier survival curves of 100 LUAD patients with high and low DEPDC1B-expressing tumors (C) Overall survival and (D) progression free interval.
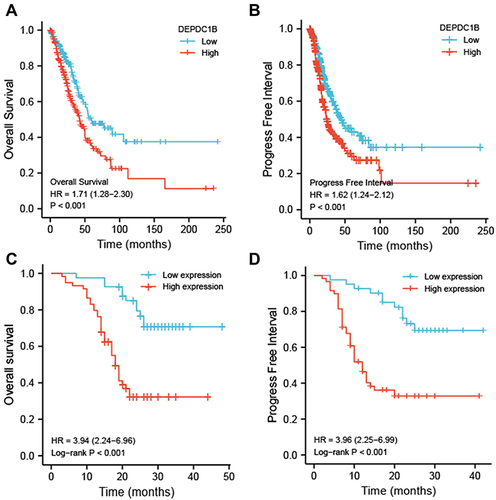
Figure 4 Relationship between DEPDC1B expression and different clinicopathological factors with overall survival. (A) Survival analysis of different clinical subgroups of patients with LUAD according to DEPDC1B expression. (B) Nomogram for predicting the outcome of patients with LUAD.
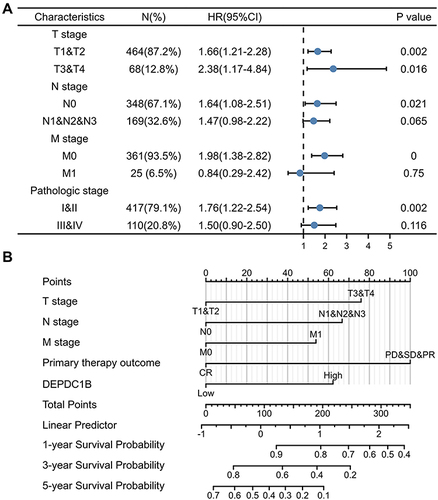
Table 1 Correlations Between DEPDC1B Expression and Overall Survival in Patients with Lung Adenocarcinoma Based on Univariate and Multivariate Cox Regression Analysis
Table 2 Univariate and Multivariate Analyses of Overall Survival and Progression Free Interval in 100 Patients with Lung Adenocarcinoma
Figure 5 Differentially expressed genes between patients with high and low DEPDC1B-expressing LUAD. (A) Volcano plot of differentially expressed genes according DEPDC1B expression status. (B) Heat map showing 10 upregulated and downregulated genes selected based on DEPDC1B expression status. (Pearson). GO enrichment analysis of DEPDC1B expression-related genes. (C) Enriched GO biological process terms. (D) Enriched GO cellular component terms. (E) Enriched GO molecular function terms. *P < 0.05; **P < 0.01; ***P < 0.001.
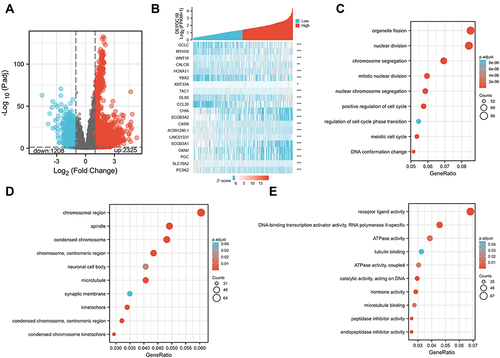
Figure 6 Enrichment plot from gene set enrichment analysis (GSEA). (A) Retinoblastoma gene in cancer, (B) cell cycle checkpoints, (C) PLK1 pathway, (D) mitotic spindle checkpoint, (E) deposition of new CENP-A-containing nucleosomes at the centromere, (F) meiotic recombination, (G) DNA replication, and (H) resolution of sister chromatid cohesion.
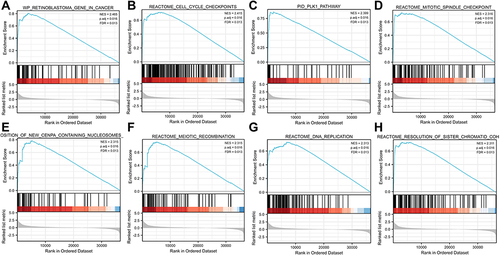
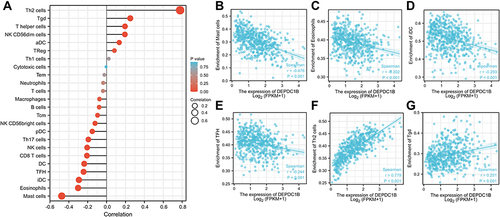
Figure 7 Correlations between immune cell infiltration and DEPDC1B expression levels in LUAD. (A) Relationship between DEPDC1B expression and infiltration of 24 immune cell types. Relationship between DEPDC1B expression and infiltration of (B) mast cells, (C) eosinophils, (D) iDCs, (E) TFHs, (F) Th2 cells, and (G) Tgd cells.