Figures & data
Figure 1 Flow chart of this study.
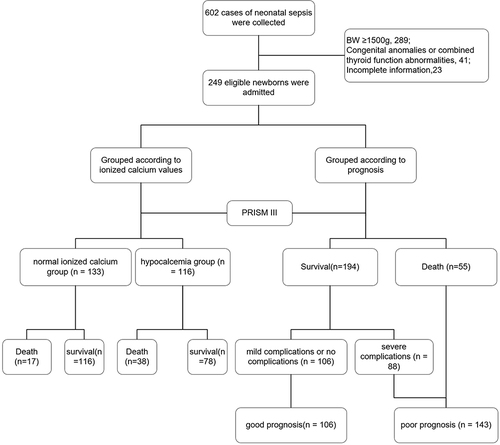
Table 1 Comparison of Clinical Data of Neonates in Different Prognostic Groups
Figure 2 The levels of BW, GA, ALB, PLT, Total Ca, iCa, and K in the mild complications or no complications group, the severe complications group, and the death group. (A) Mild complications or no complications group; (B) severe complications group; (C) the death group.
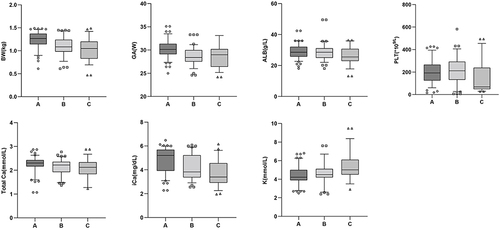
Table 2 Clinical and Demographic Characteristics in the Hypocalcemia and Normal iCa Groups
Table 3 Logistic Analysis Results of Predictors for Poor Outcomes in VLBWI with Sepsis
Table 4 Results of Stepwise Logistic Regression Analysis of Predictors for Poor Outcomes in VLBWI with Sepsis
Table 5 Logistic Analysis Results of Predictors for Death in the Poor Prognosis Group
Figure 3 (A) ROC curve for iCa, ALB, BW, GA, PRISM III in predicting poor prognosis in VLBWI with sepsis; (B) ROC curve for iCa, K, PLT, PRISM III predicting death in the poor prognosis group.
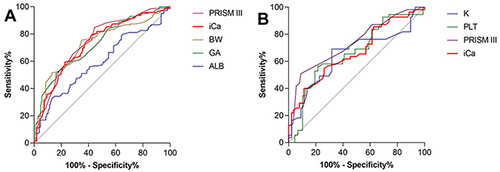
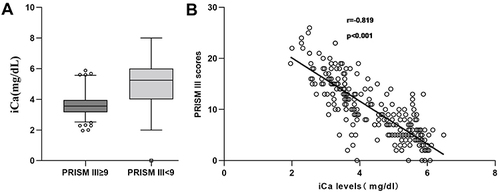
Figure 4 Correlation of iCa levels with PRISM III. (A) iCa levels in different PRISM III score groups; (B) scatter plot of correlation between iCa and PRISM III score.