Figures & data
Table 1 Basic Information of the Selected Datasets
Figure 1 Identification of DEGs in the brain of rats after stroke. (A). Volcano plot representing DEGs between MCAO/R groups and SHAM groups shows DEGs in GSE61616 and GSE97537 datasets, respectively. (B). Venn diagrams showing the overlaps of numbers of DEGs between 2 selected GEO datasets.
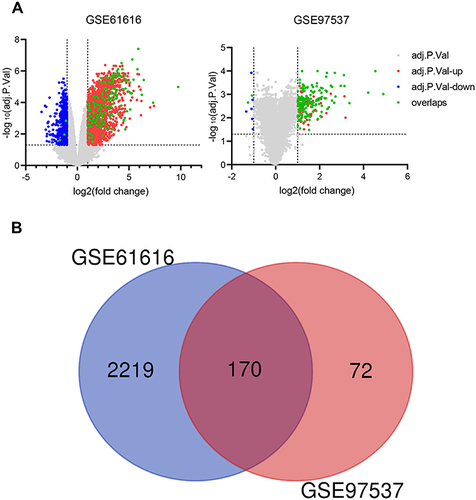
Figure 2 GSEA analysis of the two GEO datasets. (A) GSEA analysis results for GSE61616. (B) GSEA analysis results for GSE97537.
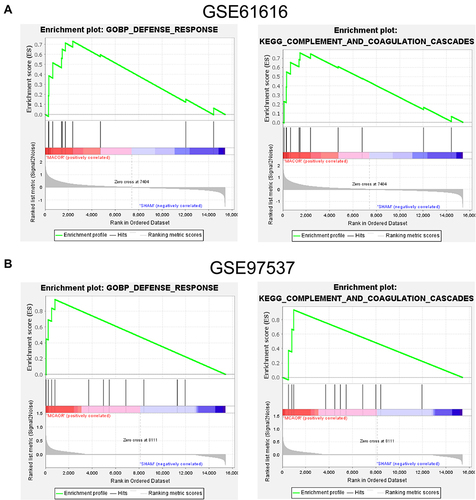
Figure 3 Functional Enrichment Analysis of DEGs. (A) Bubble plot of GO and KEGG enrichment analysis results from the DAVID online website. (B) Bar graph of GO and KEGG enrichment analysis results from the online website of Metascape.
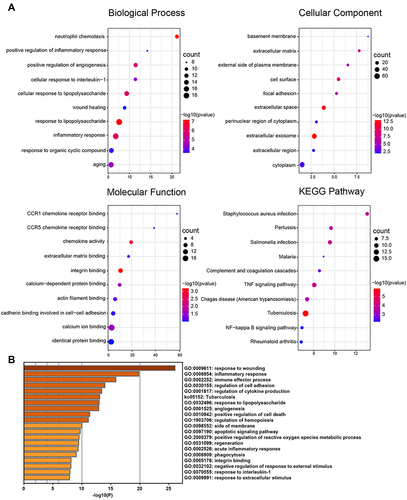
Figure 4 Functional Enrichment Analysis of DEGs using ClueGO. (A) ClueGO was used to analyze the interaction network of enriched biological processes; multiple color dots imply that a DEG is involved in multiple biological processes. (B) The pie charts show the enrichment of various biological processes; the gray sector represents paths with a proportion < 1.8%.
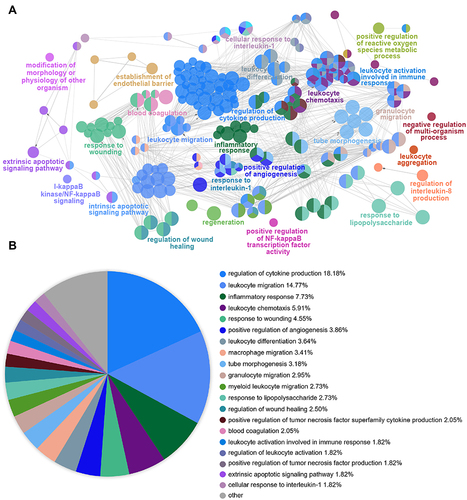
Figure 5 PPI network and function module identification. (A) Protein‐protein interaction network was processed with Metascape, and different clusters were noted with different colors. (B) Major biological processes associated with the red and blue clusters.
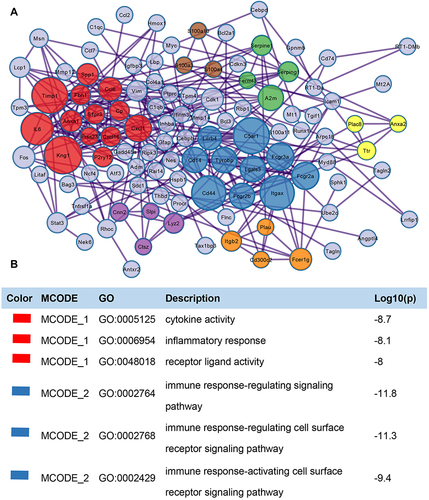
Figure 6 Multi-software screening for genes highly associated with inflammation. (A) STRING enriched biological processes; molecules related to inflammatory response are shown in red, molecules related to response to cytokine in blue, and molecules related to defense response in green. (B) Red cluster enriched biological processes, and genes associated with inflammatory responses.
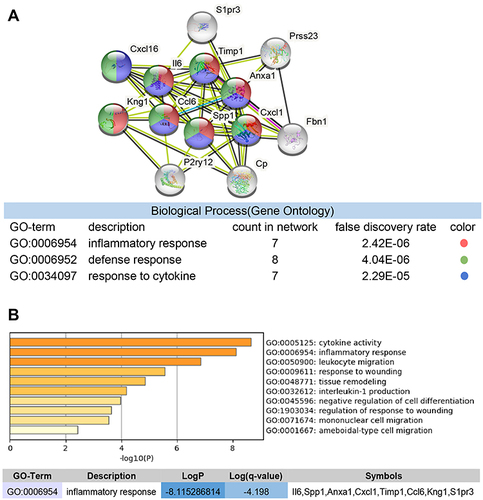
Figure 7 miRNA Prediction with Target Scan. Interaction network between genes involved in the inflammatory response and its targeted miRNAs. Genes are colored in red, and miRNAs are colored in pink.
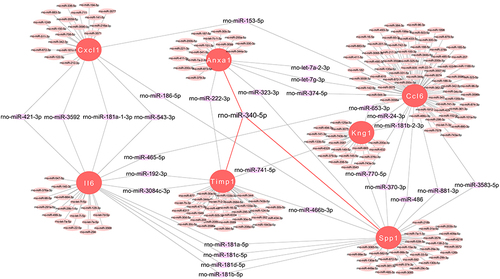
Figure 8 Validation of critical genes and miRNAs in the MCAO/R model. (A) TTC staining of rat MCAO/R model. (B) HE staining of rat MCAO/R model. (C) RT-PCR verification of sham and MCAO/R model. Mean ± SEM, n = 6, ****p < 0.0001, vs Sham group.
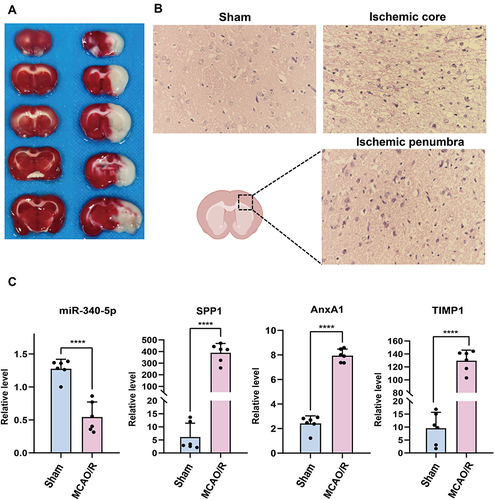
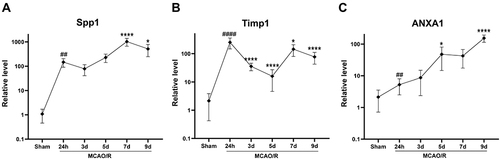
Figure 9 Time course of SPP1/TIMP1/AnxA1 mRNA expression in the ischemic penumbra of rats after MCAO/R. (A) SPP1, (B) TIMP1, (C) AnxA1. Mean ± SEM, n = 6, ##p < 0.01, ####p < 0.0001, vs Sham group. *p < 0.05, ****p < 0.0001, vs MCAO/R 24h group.