162
Views
1
CrossRef citations to date
0
Altmetric
CLINICAL TRIAL REPORT

Anti-Inflammatory Effect of Ulinastatin on the Association Between Inflammatory Phenotypes in Acute Type A Aortic Dissection

, , &
Pages 3709-3718 | Published online: 27 Jun 2022

Figures & data

Figure 1 Patient selection flow chart.

Figure 1 Patient selection flow chart.

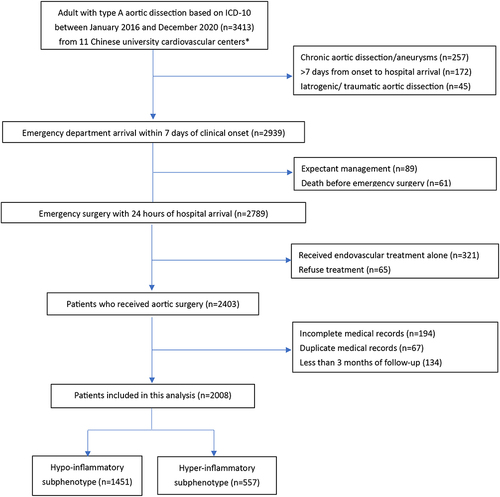
Table 1 Baseline and Clinical Characteristics and Class-Defining Variables Between Subphenotypes

Table 2 Model Fit Statistics for One to Four Latent Classes of Subjects with ATAAD

Figure 2 Differences in standardised values of each continuous variable by subphenotype. Variables are sorted on the basis of the degree of separation between the subphenotypes, from maximum positive separation on the left (ie, hyperinflammatory subphenotype higher than hypoinflammatory subphenotype) to maximum negative separation on the right (ie, hyperinflammatory subphenotype lower than hypoinflammatory subphenotype). The y-axis represents standardised variable values, in which all means are scaled to 0 and SDs to 1. A value of +1 for the standardised variable signifies that the mean value for a given subphenotype was 1 SD higher than the mean value in the cohort as a whole. Mean values are joined by lines to facilitate display of subphenotype profiles.

Abbreviations: NLR, neutrophils-lymphocyte ratio; PLR, platelet–lymphocyte ratio; LMR, lymphocyte–monocyte ratio; SII, systemic inflammation-immune index; BUN, blood urea nitrogen; ALT, alanine aminotransferase.
Figure 2 Differences in standardised values of each continuous variable by subphenotype. Variables are sorted on the basis of the degree of separation between the subphenotypes, from maximum positive separation on the left (ie, hyperinflammatory subphenotype higher than hypoinflammatory subphenotype) to maximum negative separation on the right (ie, hyperinflammatory subphenotype lower than hypoinflammatory subphenotype). The y-axis represents standardised variable values, in which all means are scaled to 0 and SDs to 1. A value of +1 for the standardised variable signifies that the mean value for a given subphenotype was 1 SD higher than the mean value in the cohort as a whole. Mean values are joined by lines to facilitate display of subphenotype profiles.

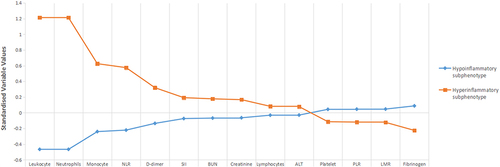
Table 3 Clinical Outcomes by ATAAD Inflammatory Subphenotype

Figure 3 Kaplan-Meier survival curves. 90-day patient survival in stratified by acute type A aortic dissection inflammatory subphenotype.

Figure 3 Kaplan-Meier survival curves. 90-day patient survival in stratified by acute type A aortic dissection inflammatory subphenotype.

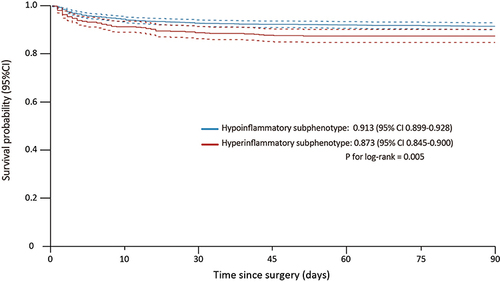
Table 4 Analysis of Clinical Outcome of Interest Across Patients Stratified by Ulinastatin Treatment and Subphenotype