Figures & data
Table 1 Patient Clinical Characteristic
Figure 1 Baseline levels of cytokines, chemokines, growth factors Baseline levels of plasma cytokines (A), chemokines (B), growth factors (C), and MMPs (D) in healthy controls and patients with TAK. *P < 0.05, **P < 0.01.
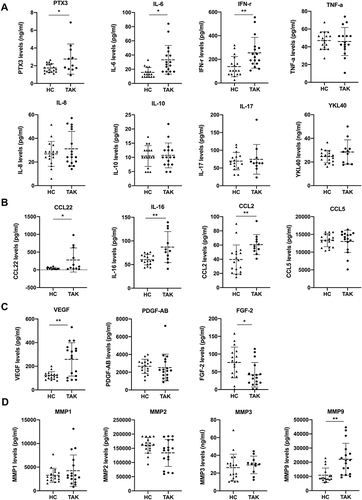
Table 2 Disease Evaluation After Treatment with GCs and TOF
Figure 2 Changes in cytokines, chemokines, growth factors, and MMPs after treatment with GCs and TOF in TAK patients. Changes in the levels of cytokines (A), chemokines (B), growth factors (C), and MMPs (D) at 6 and 12 months after treatment with GCs and TOF.
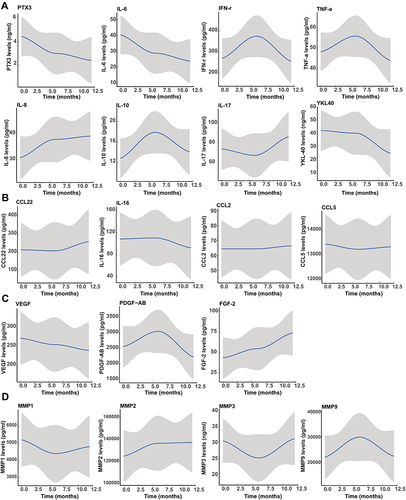
Figure 3 Potential biomarkers related with disease activity in TAK. (A, C, E, and G): Evaluation of different groups of factors that may be related to NIH score at baseline by radar plot. (B, D, F, and H): Changes in each group of factors at baseline, 6 months, and 12 months after treatment visualized by radar plot.
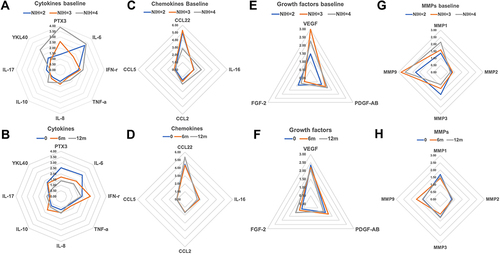
Table 3 Molecular Signatures Associated with Vascular Lesions or Imaging Changes in TAK
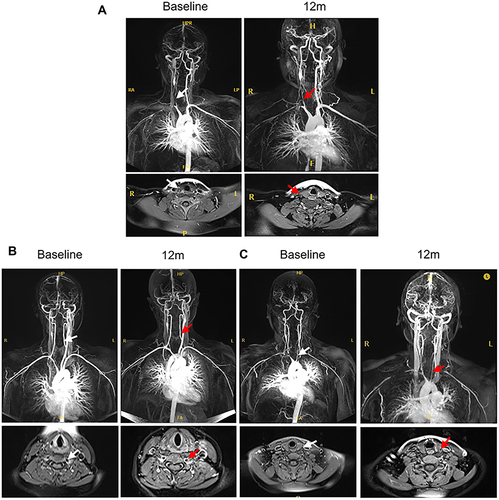
Figure 4 Imaging changes after 12 months of treatment. (A). A 28-year-old female patient with a disease course of 29 months. Before GCs and TOF treatment, the CCL22 levels were 40.83 pg/mL. MRA indicated that the involved vessels exhibited stenosis and occlusion of the right common carotid artery. After 12 months of treatment, the CCL22 levels were 29.22 pg/mL, and MRA suggested that the wall of the right common carotid artery was improved. White arrow: right common carotid artery before treatment, red arrow: right common carotid artery after GCs and TOF treatment. (B). A 31-year-old woman with a disease course of 24 months. The CCL22 levels before and after treatment were 981.05 pg/mL and 1085.58 pg/mL, respectively, and MRA showed thickening of the left vertebral artery was worsened after treatment. White arrow: left vertebral artery before treatment, red arrow: left vertebral artery after GCs and TOF treatment. (C). A 32-year-old woman with a disease course of 30 months. The levels of FGF-2 before and after treatment were 19.41 pg/mL and 133.86 pg/mL, respectively. MRA showed thickening of left common carotid artery wall after treatment. White arrow: left common carotid artery before treatment, red arrow: left common carotid artery after GCs and TOF treatment.