Figures & data
Table 1 The Grading Standard of NPS
Table 2 Clinical Characteristics of Patients
Figure 1 ROC curves of LDH, SII, PLR, CEA, and NSE cutoff values were determined.
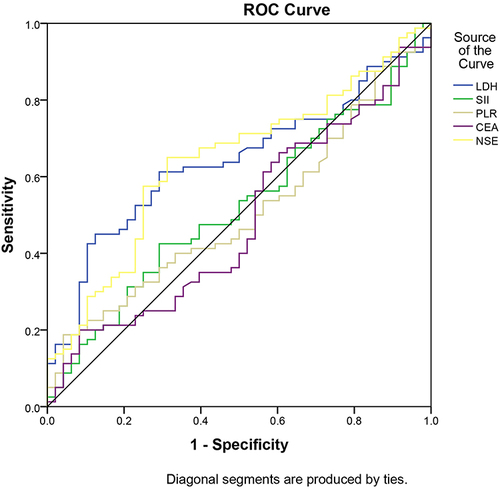
Table 3 Relationship Between Patient Characteristics and NPS Grade
Table 4 Univariate and Multivariate Analysis for PFS
Figure 2 (A) Maier curves of PFS for each NPS group. (B) Maier curves of OS for each NPS group.
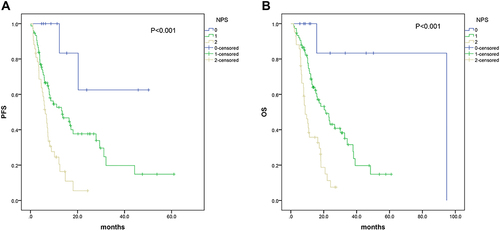
Table 5 Univariate and Multivariate Analysis for OS
Figure 3 The 1-and 2-year nomogram predictive model for OS in SCLC patients.
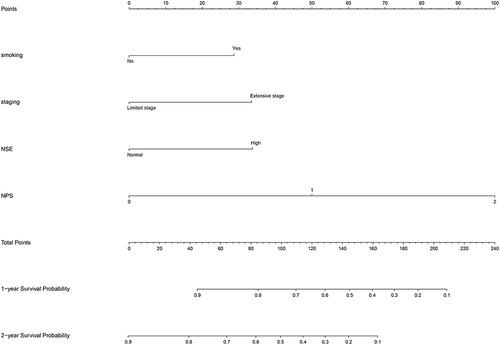
Figure 4 ROC curves of the nomogram predictive model for the main queue.
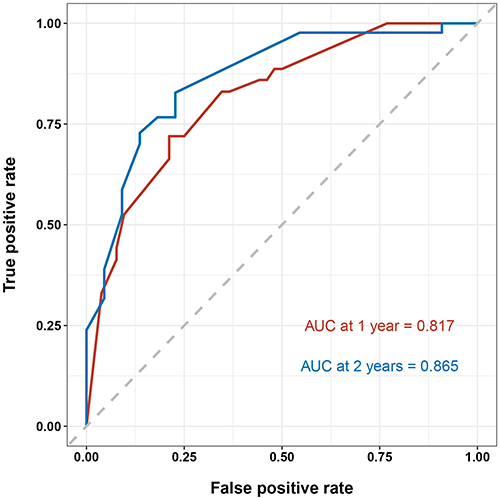
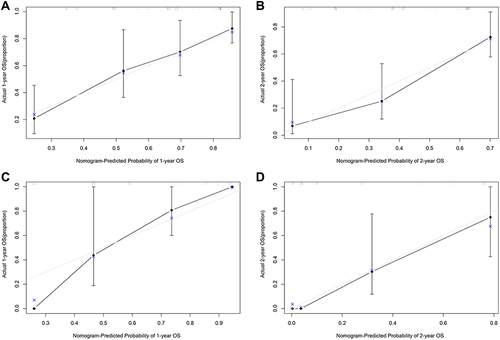
Figure 5 (A) The calibration curves for predicting SCLC patients’ OS 1-year in the main queue. (B) The calibration curves for predicting SCLC patients’ OS 2-year in the main queue. (C) The calibration curves for predicting SCLC patients’ OS 1-year in the validation queue. (D) The calibration curves for predicting SCLC patients’ OS 2-year in the validation queue.