Figures & data
Table 1 Sequences of Primers Used in the qRT-PCR
Figure 1 Vitamin D (VitD) decreases alveolar simplification and lung fibrosis induced by hyperoxia in newborn mice. (A–E) Hematoxylin and eosin images showing the characteristic simplification of lung alveolarization in the bronchopulmonary dysplasia group. VitD therapy improved lung alveolarization, as quantified by mean linear intercept, radial alveolar count, lung injury score, and septal thickness changes. (F–G) Representative Masson’s trichrome staining of lung tissues. VitD treatment ameliorated lung fibrosis induced by hyperoxia, as quantified by changes in the collagen rate of the septal area. The results shown were observed in at least three independent experiments. N = 10 mice per group; scale bar = 50 µm; magnification at 20X. *p < 0.05; **p < 0.01; ****p < 0.0001.
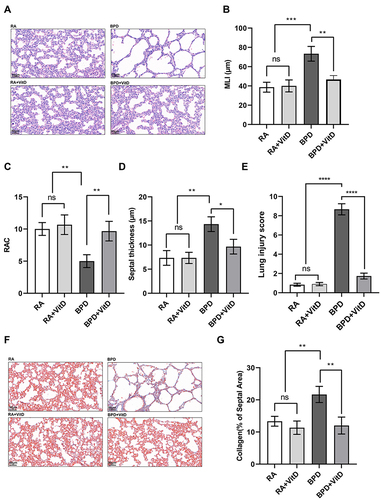
Figure 2 Vitamin D (VitD) treatment reduces the pro-inflammatory cytokines and represses the apoptosis in lungs of bronchopulmonary dysplasia (BPD) mice. (A) RT-qPCR detection of IL-6, IFN-γ, and TNF-α genes, showing their induction in the BPD mice and suppression by VitD treatment. (B) The protein levels of IL-6, IFN-γ, and TNF-α measured by ELISA showed their induction in the BPD mice and repression in the VitD treatment group. (C) The count of TUNEL-positive cells, detected by immunofluorescence, increased in the BPD mice and decreased with VitD treatment. TUNEL-positive cells were labeled with FITC fluorescence (green). The results shown were observed in at least three independent experiments. N = 10 mice per group; scale bar = 100 μm; magnification at × 10; ****p < 0.0001.
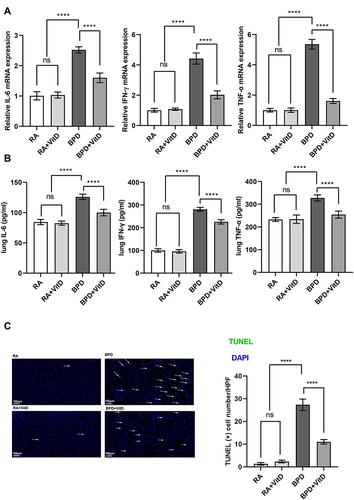
Figure 3 Vitamin D (VitD) ameliorates apoptosis by targeting its mitochondrial pathway in BEAS-2B cells under hyperoxia. (A) Ultrastructural changes were observed under TEM (magnification at × 2000, × 5000, × 12,000). The mitochondrial morphological characteristics (red arrows) are shown, as quantified by the abnormal mitochondrial structure score. Abnormal mitochondria were detected in the bronchopulmonary dysplasia (BPD)group, while the BPD+VitD group showed normal mitochondrial morphology. (B) Mitochondrial membrane potential (MMP) was determined by flow cytometry using JC-1 staining. The upper right quadrant (AP2) is labeled as JC-1 red (intact fraction, high MMP) and the lower right quadrant (AP4) as JC-1 green (damaged fraction, low MMP). The bar graph shows the quantitative analysis of the loss of MMP. VitD pretreatment reversed the loss of MMP in BEAS-2B cells induced by hyperoxia. Fifty thousand cells were analyzed in each sample. (C) The repression of cleaved caspase-3 and Bax detected by Western blot in the VitD treatment group compared to the BPD group. The Bcl-2 expression increased with VitD pretreatment in relation to the BPD group. (D) Bax expression increased and Bcl-2 decreased in mitochondria detected by Western blot in the BPD group. The Bax/Bcl-2 ratio decreased with VitD pretreatment in relation to the BPD group. Western blot densitometric values were normalized to GAPDH. The results shown were observed in at least three independent experiments. N (Number of samples per group) = 10. ** p < 0.01, *** p < 0.001, **** p< 0.0001.
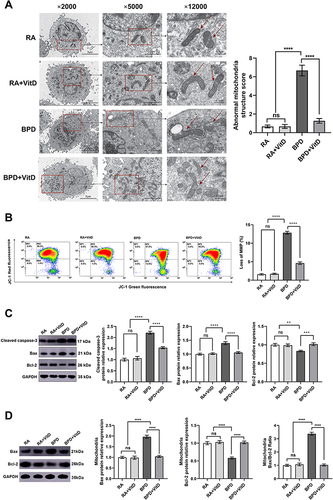
Figure 4 Inhibition of VDR regulates inflammation and apoptosis through the MEK1/2-ERK1/2 pathway in BEAS-2B cells exposed to hyperoxia. (A) The RT-qPCR detected repression of IL-6, IFN-γ, and TNF-α mRNA levels in the BPD+VitD group in relation to the BPD group, which were further repressed with the addition of the VDR inhibitor TEI-9647. (B and C) Proportions of living and apoptotic cells were detected by flow cytometry analysis. The percentage of surviving cells is shown in the lower left quadrant (K3), early apoptotic cells are shown in the lower right quadrant (K4), and late apoptotic cells are shown in the upper right quadrant (K2). The apoptotic cell rate (K2+K4) decreased in the BPD+VitD group and increased with the addition of the inhibitor TEI-9647. Ten thousand cells were analyzed in each sample. (D–F) Western blot detected MEK1/2 and ERK1/2 phosphorylation inhibition in the BPD+VitD group, which were reversed by TEI-9647 treatment. Graphs show the quantitative analysis of the protein expression levels in the five groups. Western blot densitometric values were normalized to GAPDH. Results shown were observed in at least three independent experiments. N (Number of samples per group) = 10. *p < 0.05; **p < 0.01, ***p < 0.001, ****p < 0.0001.
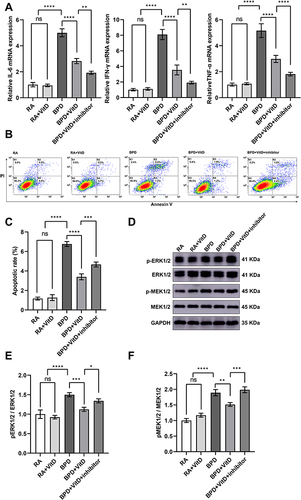
Figure 5 VDR Silencing mediates inflammation and apoptosis via the MEK1/2-ERK1/2 pathway in BEAS-2B cells under hyperoxia. (A) IL-6, IFN-γ, and TNF-α transcription were repressed in the BPD+VitD group, while VDR silencing in the BPD+VitD+VDR-shRNA restores the mRNA levels of these genes. (B and C) Lower percentages of early and late apoptotic cells (K2+K4) detected by flow cytometry were reduced in the BPD+VitD group and increased by the performance of VDR-shRNA. Ten thousand cells were analyzed in each sample. (D–F) Phosphorylation of MEK1/2 and ERK1/2 were reduced in the BPD+VitD group and reversed by the expression of VDR-shRNA. Western blot densitometric values were normalized to GAPDH. The results shown were observed in at least three independent experiments. N (Number of samples per group) = 10. **p < 0.01, ***p < 0.001, ****p < 0.0001.
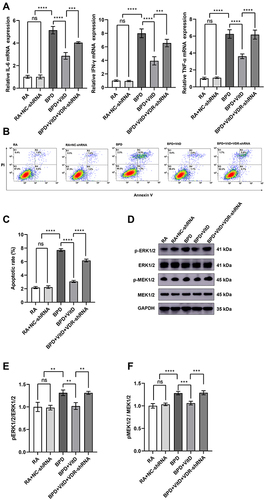
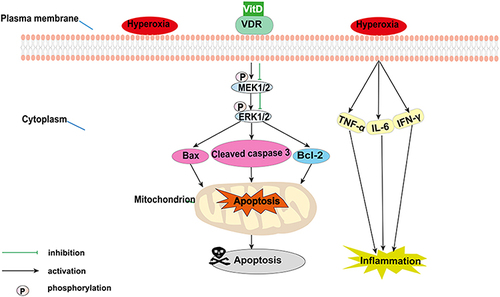
Figure 6 Vitamin D (VitD) modulates the mitochondrial apoptosis pathway and the MEK1/2-ERK1/2 pathway in bronchopulmonary dysplasia. Hyperoxia induces MEK1/2 and ERK1/2 phosphorylation and releases pro-inflammatory cytokines. Subsequently, the expression of mitochondrial apoptosis-related proteins (cleaved caspase-3, Bax, and Bcl-2) are altered. VitD pretreatment reversed these hyperoxia-induced alterations, inhibiting inflammation and apoptosis.