Figures & data
Table 1 Histological Scoring Criteria
Figure 1 ATR reduced H. pylori-induced gastric mucosal damage. (A) H&E-stained histological sections of gastrointestinal tract tissue. The double-headed arrow shows the diameter of intestinal lumen, single-headed arrows indicate gastrointestinal folds. Fluorescence microscopy images showing the area of mucosal injury (single-headed arrows indicate the site of analysis of the zebrafish gastrointestinal tract) (B), number of neutrophils (C), and number of H. pylori (D) in gastrointestinal tract. Quantitative results of mucosal injury area (E), number of neutrophils (F), and H. pylori fluorescence intensity (G). Data are expressed as mean ± SD (n = 10). ***p < 0.001.
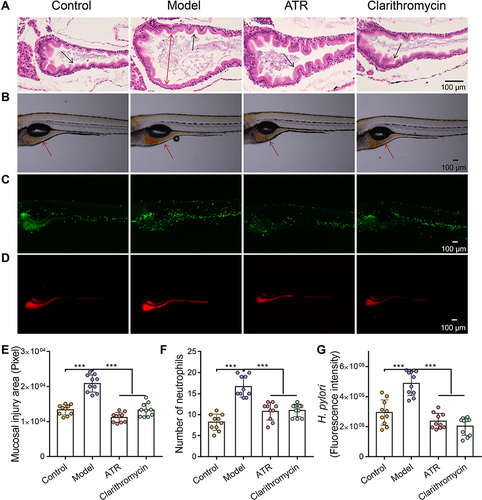
Figure 2 ATR mitigated EtOH-induced gastric mucosal damage. (A) Gastric tissues morphology of rat. (B) H&E-stained histological sections of gastric tissues. (C) Gastric ulcer area ratio. Data are expressed as mean ± SD (n = 8), **p < 0.01. (D) Histopathological score of gastric tissues. Data are expressed as mean ± SD (n = 4), *p < 0.05, ***p < 0.001.
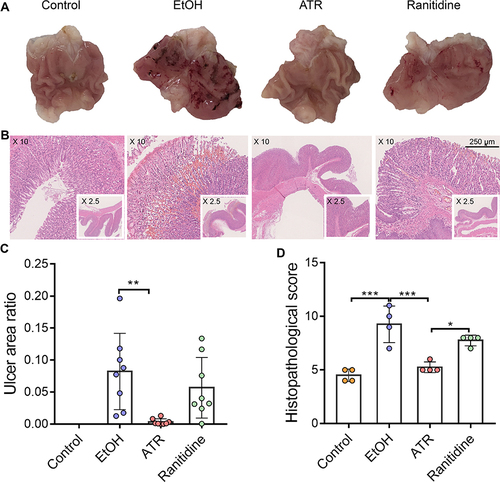
Figure 3 ATR alleviated EtOH-induced oxidative stress and inflammation. (A) SOD, (B) MDA, (C) TNF-α, (D) NO, and (E) IL-10 levels in the serum samples of the indicated groups. Data are expressed as mean ± SD (n = 8). *p < 0.05, **p < 0.01, ***p < 0.001.
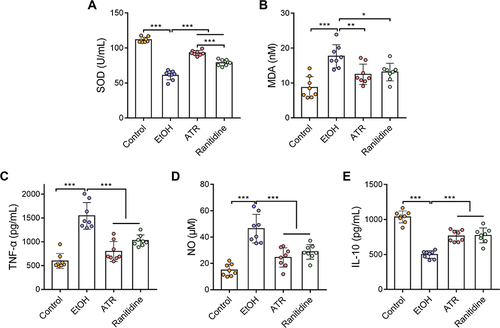
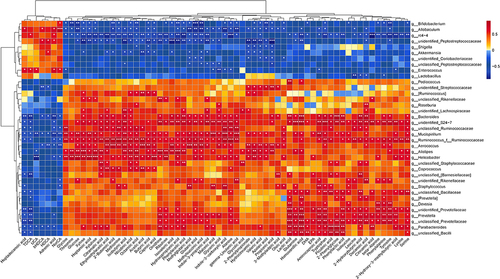
Figure 4 ATR altered the gut microbiota in gastric ulcer rats. (A) Chao 1 index and Simpson index. (B) Microbiota community analysis based on PCoA score plots. *p < 0.05 was considered statistically significant compared with EtOH group. (C) Microbiota distribution at the phylum level. *p < 0.05 and **p < 0.01 were considered statistically significant compared with control group. ##p < 0.01 was considered statistically significant compared with EtOH group. (D) Heatmap of the top 50 differentiated taxa at the genus level. (E) Difference of fecal microbial abundance based on LEfSe analysis. Differential changes of Mucispirillum (F), Parabacteroides (G), Bacteroides (H), and Bifidobacterium (I) at the genus level. *p < 0.05 was considered statistically significant compared with EtOH group. Data are expressed as mean ± SD (n = 6).
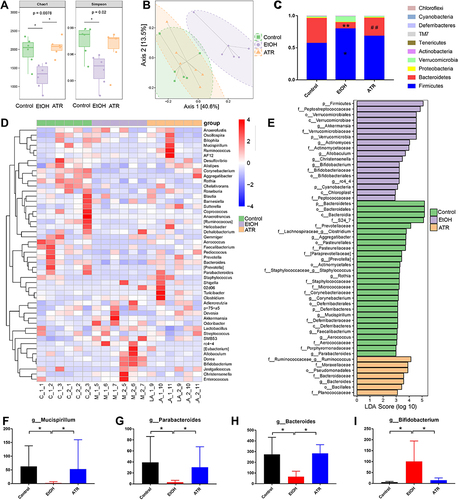
Figure 5 ATR altered the composition of metabolites in the fecal of GU rats. (A) Relative abundance of metabolites. (B) The PCA score plot. (C) The OPLS-DA score plot between control and EtOH group. (D) The OPLS-DA score plot between EtOH and ATR group. (E) Volcano plot of univariate statistical analysis metabolites between control group and EtOH group. (F) Volcano plot of univariate statistical analysis metabolites between EtOH group and ATR group. (G) Pathway analysis between control group and EtOH group. (H) Pathway analysis between EtOH group and ATR group. (a, aminoacyl−tRNA biosynthesis; b, phenylalanine metabolism; c, phenylalanine, tyrosine and tryptophan biosynthesis; d, pantothenate and CoA biosynthesis; e, cyanoamino acid metabolism; f, Glycine, serine and threonine metabolism). Changes of amino acids (phenylalanine and tryptophan) (I), SCFAs (butyric acid and acetic acid) (J), and bile acids (DCA and TDCA) (K) with univariate analysis. *p < 0.05, **p < 0.01. Data are expressed as mean ± SD (n = 6).
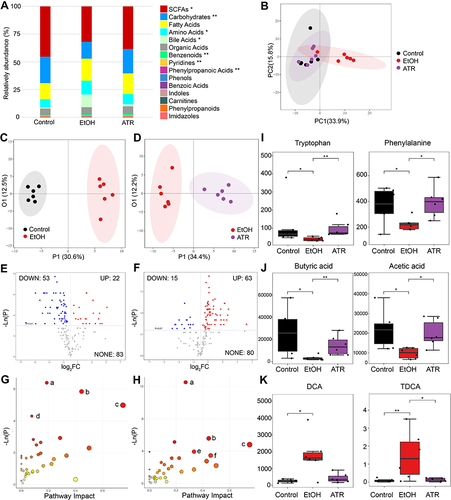
Figure 6 Correlation analysis of microbiota and metabolites. *p < 0.05, **p < 0.01, ***p < 0.001.