151
Views
0
CrossRef citations to date
0
Altmetric
ORIGINAL RESEARCH

C-X-C-Chemokine-Receptor-Type-4 Inhibitor AMD3100 Attenuates Pulmonary Inflammation and Fibrosis in Silicotic Mice

, , , , , ORCID Icon, , , & show all
Pages 5827-5843 | Received 11 May 2022, Accepted 20 Sep 2022, Published online: 11 Oct 2022

Figures & data

Figure 1 Silica particles induced pathological changes and increased CXCL12/CXCR4 expression in the mouse lung. (A) Represent histological sections of mouse lung on day 28 in CS-exposed group versa control one. Mice were administrated intranasally with 12 mg CS in 60 µL PBS and 60 µL PBS as the vehicle control. The low magnification (40×) of CS-exposed lung showed extensive silica nodule formation compared with the control in upper images. The large magnification (200×) showed lung architecture is normal in the control group (N=6), and the CS group (N=6) showed obvious trachea and alveolar wall thickening, inflammatory cells infiltration, and the formation of silicotic nodules in the middle images. Arrows indicate lymphoid clusters. Asterisk indicates reactive inflammatory cells. Pound signs indicate silicotic nodules. The bottom images showed crystalline silica under a polarizing light microscope. White arrows indicate CS. (B) The expressions of CXCL12/CXCR4 in the lung were assessed after CS exposure by immunohistochemistry staining. The quantitative analyses of CXCL12 (C) and CXCR4 (D) expression in the lung were shown. IOD: integrated optical density. Scale bar: 50 µm. ***P < 0.001 vs the control group.
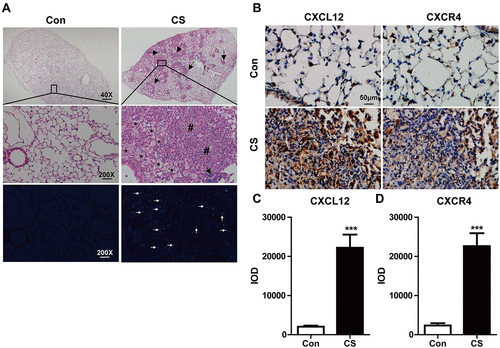
Figure 1 Silica particles induced pathological changes and increased CXCL12/CXCR4 expression in the mouse lung. (A) Represent histological sections of mouse lung on day 28 in CS-exposed group versa control one. Mice were administrated intranasally with 12 mg CS in 60 µL PBS and 60 µL PBS as the vehicle control. The low magnification (40×) of CS-exposed lung showed extensive silica nodule formation compared with the control in upper images. The large magnification (200×) showed lung architecture is normal in the control group (N=6), and the CS group (N=6) showed obvious trachea and alveolar wall thickening, inflammatory cells infiltration, and the formation of silicotic nodules in the middle images. Arrows indicate lymphoid clusters. Asterisk indicates reactive inflammatory cells. Pound signs indicate silicotic nodules. The bottom images showed crystalline silica under a polarizing light microscope. White arrows indicate CS. (B) The expressions of CXCL12/CXCR4 in the lung were assessed after CS exposure by immunohistochemistry staining. The quantitative analyses of CXCL12 (C) and CXCR4 (D) expression in the lung were shown. IOD: integrated optical density. Scale bar: 50 µm. ***P < 0.001 vs the control group.

Figure 2 Blocking CXCR4 expression alleviated CS-induced lung injury and bodyweight loss. (A) 10–12 weeks C57BL/6 mice were randomly divided into three groups: the control group (60 μL PBS), the CS group (12 mg in 60 μL PBS), and the CS+AMD3100 group. Mice in the CS+AMD3100 group were treated with the following step. 12 mg CS in 60 μL PBS were instilled intranasally into the mouse 12 hours before AMD3100 treatment. Following CS exposure, AMD3100 (5 mg/kg) was injected intraperitoneally once a day for a week. Mice were sacrificed on days 7,14 and 28. Samples were collected and analyzed. (B) Representative presentation of HE staining of the whole lung tissue section on days 7, 14, and 28. (C) Quantitative analysis of pathological scores in the lung among three groups was presented. Scale bar: 500 μm. N=4 per group. (D) Bodyweight was measured daily for each group. Weight loss is significant in the CS group (red line) when compared with the control group (blue line), but CXCR4 antagonist AMD3100 attenuated weight loss in the CS+AMD3100 group (green line), shown in the graph. N=7 per group. *p < 0.05, **p < 0.01, ***P < 0.001 vs the control group. #P < 0.05, ##P < 0.01 vs the CS group.
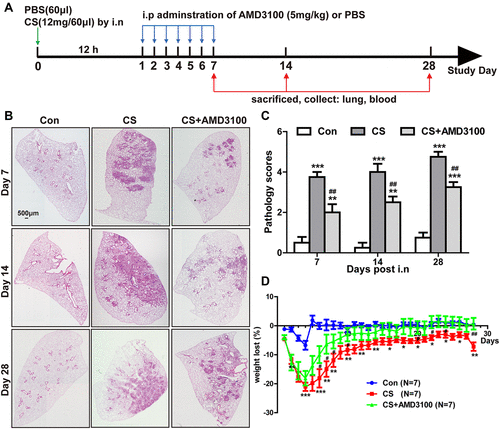
Figure 2 Blocking CXCR4 expression alleviated CS-induced lung injury and bodyweight loss. (A) 10–12 weeks C57BL/6 mice were randomly divided into three groups: the control group (60 μL PBS), the CS group (12 mg in 60 μL PBS), and the CS+AMD3100 group. Mice in the CS+AMD3100 group were treated with the following step. 12 mg CS in 60 μL PBS were instilled intranasally into the mouse 12 hours before AMD3100 treatment. Following CS exposure, AMD3100 (5 mg/kg) was injected intraperitoneally once a day for a week. Mice were sacrificed on days 7,14 and 28. Samples were collected and analyzed. (B) Representative presentation of HE staining of the whole lung tissue section on days 7, 14, and 28. (C) Quantitative analysis of pathological scores in the lung among three groups was presented. Scale bar: 500 μm. N=4 per group. (D) Bodyweight was measured daily for each group. Weight loss is significant in the CS group (red line) when compared with the control group (blue line), but CXCR4 antagonist AMD3100 attenuated weight loss in the CS+AMD3100 group (green line), shown in the graph. N=7 per group. *p < 0.05, **p < 0.01, ***P < 0.001 vs the control group. #P < 0.05, ##P < 0.01 vs the CS group.

Figure 3 AMD3100 effectively reduced CXCR4 and CXCL12 expression in the silicotic lung. (A and B) Representative images show CXCR4 (upper) and CXCL12 (bottom) expression in lung sections determined by immunohistochemical staining analysis on day 28. Red arrows indicate CXCR4+ cells. Green arrows indicate CXCL12+ cells. DAB-labeled tissues were analyzed using Image-Pro Plus 6.0 software, as described in the material and methods. IOD: integrated optical density. Scale bar: 100 μm. (C) The expression of CXCR4 in the lungs was analyzed by Western blot on day 7. N=3 per group. **p < 0.01, ***p < 0.001 vs the control group. #P < 0.05, ##P < 0.01 vs the CS group.
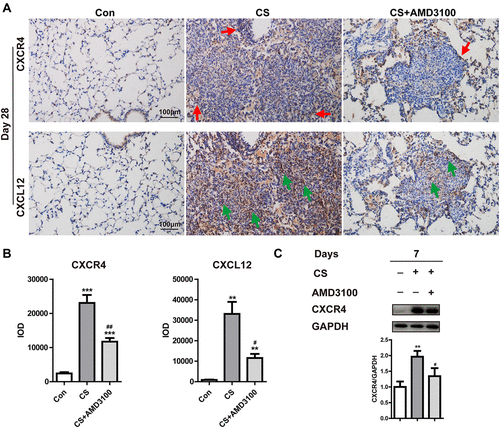
Figure 3 AMD3100 effectively reduced CXCR4 and CXCL12 expression in the silicotic lung. (A and B) Representative images show CXCR4 (upper) and CXCL12 (bottom) expression in lung sections determined by immunohistochemical staining analysis on day 28. Red arrows indicate CXCR4+ cells. Green arrows indicate CXCL12+ cells. DAB-labeled tissues were analyzed using Image-Pro Plus 6.0 software, as described in the material and methods. IOD: integrated optical density. Scale bar: 100 μm. (C) The expression of CXCR4 in the lungs was analyzed by Western blot on day 7. N=3 per group. **p < 0.01, ***p < 0.001 vs the control group. #P < 0.05, ##P < 0.01 vs the CS group.

Figure 4 CXCR4 blocking alleviated MPO expression and NET formation in the lung of silicosis mice. (A and B) Immunohistochemical analysis of MPO staining was performed in the lung after CS exposure on days 7.14, and 28. Representative images and quantitative analysis of MPO were shown. (C and D) Representative double-staining immunofluorescence images showing NETs, defined as colocalized MPO (Red) and citH3 (Green) in the lung after CS-challenged at 28 days. Quantitative analysis of MPO+citH3+ cells/area (mm2) in the lung tissue was shown. White arrows indicate the NETs. N=4 per group. IOD: integrated optical density. Scale bar: 50 μm (A and C). **p < 0.01, ***p < 0.001 vs the control group. #P < 0.05, ##p < 0.01, ###p < 0.001 vs the CS group.
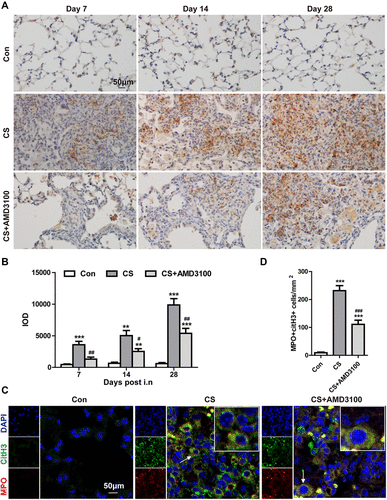
Figure 4 CXCR4 blocking alleviated MPO expression and NET formation in the lung of silicosis mice. (A and B) Immunohistochemical analysis of MPO staining was performed in the lung after CS exposure on days 7.14, and 28. Representative images and quantitative analysis of MPO were shown. (C and D) Representative double-staining immunofluorescence images showing NETs, defined as colocalized MPO (Red) and citH3 (Green) in the lung after CS-challenged at 28 days. Quantitative analysis of MPO+citH3+ cells/area (mm2) in the lung tissue was shown. White arrows indicate the NETs. N=4 per group. IOD: integrated optical density. Scale bar: 50 μm (A and C). **p < 0.01, ***p < 0.001 vs the control group. #P < 0.05, ##p < 0.01, ###p < 0.001 vs the CS group.

Figure 5 Blocking CXCR4 reduced B-lymphoid aggregate (LA) formation and collagen-I secretion by B-cells in the lung tissue after CS exposure. (A) HE staining showed LA formation 28 days after CS exposure; AMD3100 treatment reduced the number of LAs. Black arrows indicate LAs. (B) Double immunofluorescence analyses showed CD45R (B cells, green) and CD3 (T cells, red) staining in the lung after CS exposure on days 7, 14, and 28. White asterisks indicate B cells; white arrows point to T cells. (C) Quantitative analysis of CD45R+ cells and CD3+ cells/area (mm2) in the lung tissue was shown. (D) CD45R+ cells were stained with DAB (brown), and collagen-I+ cells were colored with AP (red). The brown arrowhead indicates CD45R positive collagen-I negative cells, the red arrowhead indicates CD45R negative collagen-I positive cells, and the yellow arrowhead indicates CD45R positive collagen-I positive cells. Scale bar: 100 μm (A), 50 μm (B and D). ***p < 0.001 vs control group. #P < 0.05 vs CS group.
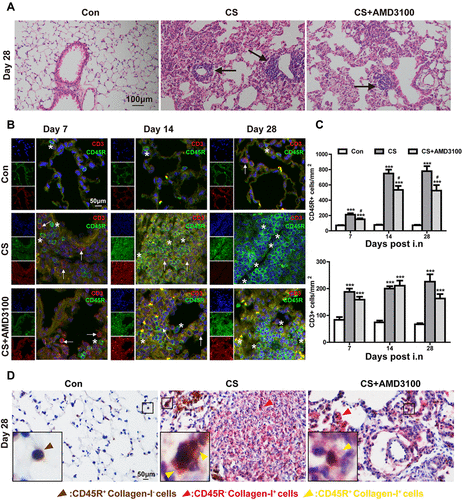
Figure 5 Blocking CXCR4 reduced B-lymphoid aggregate (LA) formation and collagen-I secretion by B-cells in the lung tissue after CS exposure. (A) HE staining showed LA formation 28 days after CS exposure; AMD3100 treatment reduced the number of LAs. Black arrows indicate LAs. (B) Double immunofluorescence analyses showed CD45R (B cells, green) and CD3 (T cells, red) staining in the lung after CS exposure on days 7, 14, and 28. White asterisks indicate B cells; white arrows point to T cells. (C) Quantitative analysis of CD45R+ cells and CD3+ cells/area (mm2) in the lung tissue was shown. (D) CD45R+ cells were stained with DAB (brown), and collagen-I+ cells were colored with AP (red). The brown arrowhead indicates CD45R positive collagen-I negative cells, the red arrowhead indicates CD45R negative collagen-I positive cells, and the yellow arrowhead indicates CD45R positive collagen-I positive cells. Scale bar: 100 μm (A), 50 μm (B and D). ***p < 0.001 vs control group. #P < 0.05 vs CS group.

Figure 6 AMD3100 up-regulated the level of CD19+ (B cells) in the peripheral blood after CS-challenged. (A) The gating strategy was shown to identify CD19+ (B cells) in the peripheral blood. A representative flow cytometry histogram of B cells (B) and bar graph of the level of B cells (C) in the peripheral blood on days 7.14, and 28 were presented. *p < 0.05, **p < 0.01 vs control group. #P < 0.05 vs CS group.
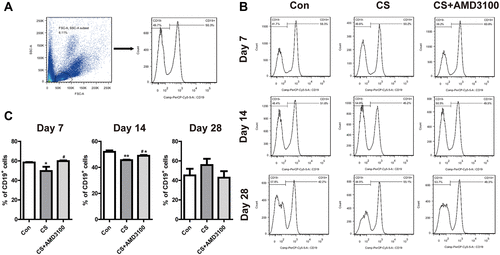
Figure 6 AMD3100 up-regulated the level of CD19+ (B cells) in the peripheral blood after CS-challenged. (A) The gating strategy was shown to identify CD19+ (B cells) in the peripheral blood. A representative flow cytometry histogram of B cells (B) and bar graph of the level of B cells (C) in the peripheral blood on days 7.14, and 28 were presented. *p < 0.05, **p < 0.01 vs control group. #P < 0.05 vs CS group.

Figure 7 Blockade CXCR4 attenuated pulmonary fibrosis in silicosis mice. (A) Representative presentation of Masson’s trichrome staining of the whole lung tissue section on days 7, 14, and 28. (B) Quantitative analysis of Ashcroft score in the lung among three groups was presented. N=4 per group. (C) Immunohistochemical staining of collagen I and α-SMA were shown on days 14 and 28 after CS exposure. Quantitative analysis of collagen I and α-SMA immunohistochemical staining was shown in (D) after CS-challenged. IOD: integrated optical density. Scale bar: 50 µm. *P < 0.05, **P < 0.01, ***P < 0.001 vs the control group. #P < 0.05, ##P < 0.01 vs the CS group.
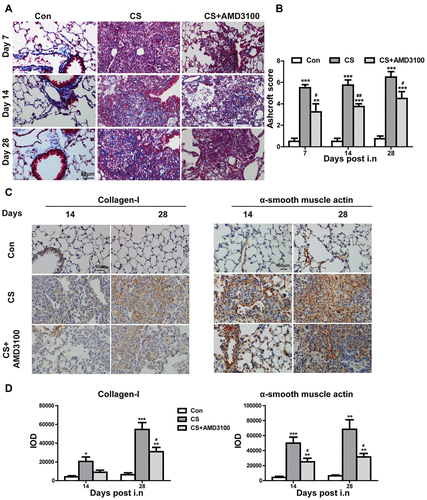
Figure 7 Blockade CXCR4 attenuated pulmonary fibrosis in silicosis mice. (A) Representative presentation of Masson’s trichrome staining of the whole lung tissue section on days 7, 14, and 28. (B) Quantitative analysis of Ashcroft score in the lung among three groups was presented. N=4 per group. (C) Immunohistochemical staining of collagen I and α-SMA were shown on days 14 and 28 after CS exposure. Quantitative analysis of collagen I and α-SMA immunohistochemical staining was shown in (D) after CS-challenged. IOD: integrated optical density. Scale bar: 50 µm. *P < 0.05, **P < 0.01, ***P < 0.001 vs the control group. #P < 0.05, ##P < 0.01 vs the CS group.

Figure 8 Blocking of CXCR4 reduced intrapulmonary recruitment of CFs to CS-injured sites. (A and B) Representative confocal images of CD45+/collagen-I+/CXCR4+ CFs assessed by immunofluorescent staining in the lung section were shown. Lung sections in control, CS, and CS+AMD3100 groups were stained with CD45-FITC(Green), CXCR4-Cy3(Red), and collagen I-Cy5(Purple). The cell nuclei were counterstained with DAPI(Blue). White arrows indicate CFs with triple colors of CD45+/collagen-I+/CXCR4+. Photos were taken under 3Dhistech (Pannoramic). Scale bar: 20 μm. *P < 0.05, **P < 0.01, ***P < 0.001 vs the control group. ###P < 0.001 vs the CS group.
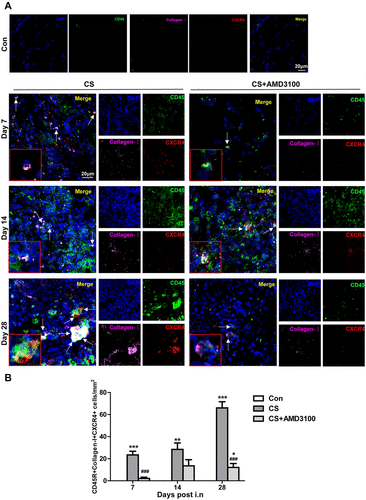
Figure 8 Blocking of CXCR4 reduced intrapulmonary recruitment of CFs to CS-injured sites. (A and B) Representative confocal images of CD45+/collagen-I+/CXCR4+ CFs assessed by immunofluorescent staining in the lung section were shown. Lung sections in control, CS, and CS+AMD3100 groups were stained with CD45-FITC(Green), CXCR4-Cy3(Red), and collagen I-Cy5(Purple). The cell nuclei were counterstained with DAPI(Blue). White arrows indicate CFs with triple colors of CD45+/collagen-I+/CXCR4+. Photos were taken under 3Dhistech (Pannoramic). Scale bar: 20 μm. *P < 0.05, **P < 0.01, ***P < 0.001 vs the control group. ###P < 0.001 vs the CS group.

Figure 9 CXCR4 blocking reduced pulmonary fibrosis in silicosis mice. CXCR4 and its ligand CXCL12 expression were up-regulated in silicosis mice, through which the CFs, neutrophils, and circulating B cells were recruited in the silicotic lung. After recruiting pro-inflammatory and pro-fibrotic cells traffic into the silicotic lung, CFs differentiated into fibroblasts, and further formed fibroblastic foci; B cells formed lymphoid aggregates and secreted collagen. In addition, neutrophils accumulated and released myeloperoxidase, forming neutrophil extracellular traps (NETs) in the inflammatory sites, and then NETs activated myofibroblasts to promote lung fibrosis. AMD3100 inhibited CXCR4 expression, which delayed the progression of pulmonary fibrosis by blocking the recruitment of multiple CXCR4 positive cells in silicosis mice.
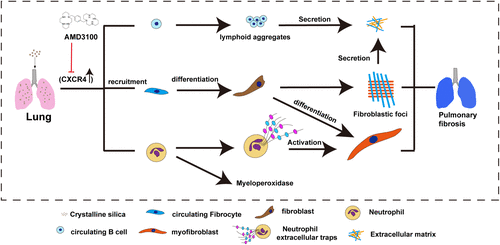
Figure 9 CXCR4 blocking reduced pulmonary fibrosis in silicosis mice. CXCR4 and its ligand CXCL12 expression were up-regulated in silicosis mice, through which the CFs, neutrophils, and circulating B cells were recruited in the silicotic lung. After recruiting pro-inflammatory and pro-fibrotic cells traffic into the silicotic lung, CFs differentiated into fibroblasts, and further formed fibroblastic foci; B cells formed lymphoid aggregates and secreted collagen. In addition, neutrophils accumulated and released myeloperoxidase, forming neutrophil extracellular traps (NETs) in the inflammatory sites, and then NETs activated myofibroblasts to promote lung fibrosis. AMD3100 inhibited CXCR4 expression, which delayed the progression of pulmonary fibrosis by blocking the recruitment of multiple CXCR4 positive cells in silicosis mice.