Figures & data
Figure 1 The effect of punicalagin on the production of pro-inflammatory mediators (NO and PGE2) by LPS-induced BV2 cells. BV2 cells were pre-treated with various concentrations (0, 25, 50, 75, 100 μM) of punicalagin for 30 min, and then treated with LPS (1 μg/mL) for 24 h. (A) The cell viability was determined by MTT assay. (B and C) The secretion of NO and PGE2 was measured by Griess reagent assay and ELISA respectively. Expressions of iNOS and COX-2 were analyzed using Western blot. The representative images are shown in (D) and the quantitative results of three independent experiments shown in (E and F). β-actin was used as a loading control. Statistical significance was indicated as *p < 0.05; **p <0.01; ***p <0.001.
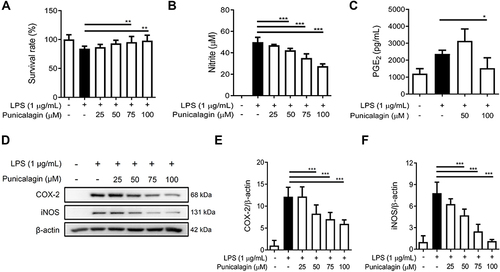
Figure 2 The effect of punicalagin on the production of IL-6 and the activation of STAT3 in LPS-induced BV2 cells. Cells were pre-treated with punicalagin (0, 25, 50, 75, 100 μM) for 30 mins and then treated with LPS (1 μg/mL) for 24 h. (A) The level of IL-6 was measured by ELISA. The data are presented as the means ± SD of three independent experiments. Statistical significance was assessed by one-way ANOVA represented as follows: ***p < 0.001 vs LPS alone. Cells were pre-treated with punicalagin (0, 25, 50, 75, 100 μM) for 30 min and then treated with LPS (1 μg/mL) for 2 h. The expression of phospho-STAT3 and STAT3 was determined by Western blot. The representative images are shown in (B) and the quantitative results of three independent experiments shown in (C). β-actin was used as a loading control. Statistical significance was indicated as ***p <0.001.
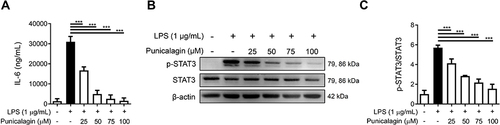
Figure 3 The effects of punicalagin on the activation of both MAPK and NF-κB signaling pathways by LPS-activated BV2 cells. BV2 cells were pre-treated with punicalagin (0, 25, 50, 75, 100 μM) for 30 min following 1 μg/mL LPS treatment for 6 h. The expressions of phospho-ERK, ERK, phospho-JNK, JNK, phospho-p38, p38 were determined by Western blot. The representative images are shown in (A) and the quantitative results of three independent experiments shown in (B–D). β-actin was used as a loading control. (E) BV2-Blue cells were pre-treated with punicalagin (0, 25, 50, 75, 100 μM) for 30 min following 1 μg/mL LPS treatment for 24 h. The activation of NF-κB was measured by detected SEAP activity. BV2 cells were pre-treated with punicalagin (0, 50, 100 μM) for 30 min following with 1 μg/mL LPS treatment for 50 min. The expressions of phospho-IκBα and IκBα by LPS-activated BV2 cells were determined by Western blot. The representative images are shown in (F) and the quantitative results of three independent experiments shown in (G). β-actin was used as a loading control. Statistical significance was indicated as *p < 0.05, **p < 0.01 and ***p < 0.001 vs LPS alone.
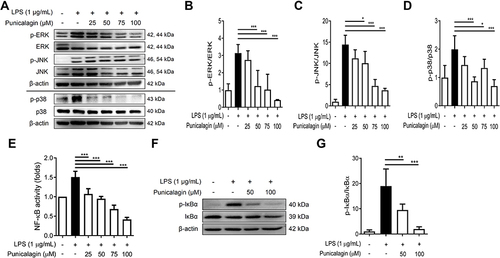
Figure 4 The effects of punicalagin on the activation of NLRP3 inflammasome by LPS/ATP-activated and LPS/nigericin-activated BV2 cells. BV2 cells were pre-treated with punicalagin (0, 25, 50, 75, 100 μM) for 30 min, and then treated with LPS (1 μg/mL) for 47.5 h followed by ATP (5 mM) or Nigericin (10 μM) treatments for 30 min. (A and B) The secretion of IL-1βwas determined by ELISA. The expressions of cleaved-IL-1β, IL-1β, cleaved-caspase-1, caspase-1, ASC and NLRP3 were analyzed by Western blot. The representative images are shown in (C and F) and the quantitative results of three independent experiments shown in (D, E, G and H). β-actin was used as a loading control. Statistical significance was indicated as *p < 0.05, **p < 0.01 and ***p < 0.001.
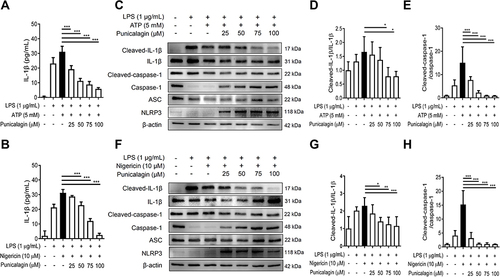
Figure 5 The effects of punicalagin on the production of intracellular ROS in LPS-activated BV2 cells. BV2 cells were pre-treated with punicalagin (0, 25, 50, 75, 100 μM) for 30 min and then treated with LPS (1 μg/mL) for 24 h. The production of (A) intracellular ROS was analyzed by flow cytometry. The quantitative value (mean fluorescence intensity) compared to the peak of LPS group (#1) was shown in (B). The data are presented as the means ± SD of three independent experiments. Statistical significance was indicated as ***p < 0.001 vs LPS alone. The immunofluorescence staining of ROS in (C) cytoplasm was examined using DCFH-DA.
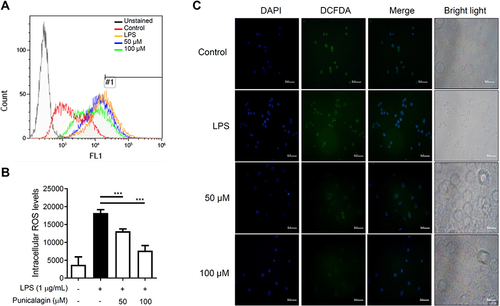
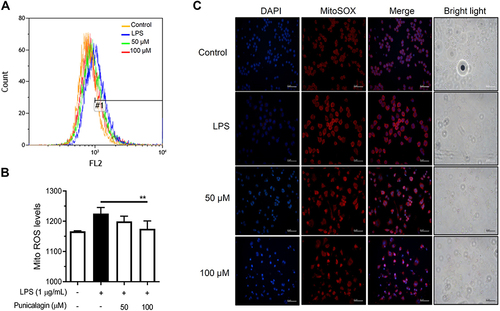
Figure 6 The effects of punicalagin on the production of mitochondrial ROS in LPS-activated BV2 cells. BV2 cells were pre-treated with punicalagin (0, 25, 50, 75, 100 μM) for 30 min and then treated with LPS (1 μg/mL) for 24 h. The production of (A) mitochondrial ROS was analyzed by flow cytometry. The quantitative value (mean fluorescence intensity) compared to the peak of LPS group (#1) was shown in (B). The data are presented as the means ± SD of three independent experiments. Statistical significance was indicated as **p < 0.01 vs LPS alone. The immunofluorescence staining of ROS in (C) mitochondria was examined using MitoSOX red staining.