Figures & data
Figure 1 rIL-17A and rIFN-γ treatment of HaCaT cells increase the release of small EVs. EVs were quantified by NTA from supernatants collected from untreated Untreated HaCaT cells (A), or treated with rIL‐17A (B), rIL-22 (C), rIL-23 (D), rTNF-α (E) and rIFN-γ (F) for 72 hours as described in Materials and Methods. Each sample was acquired three times at 22.2–22.3°C. The solid line represents the acquisitions mean while the dashed lines represent ± standard deviations.
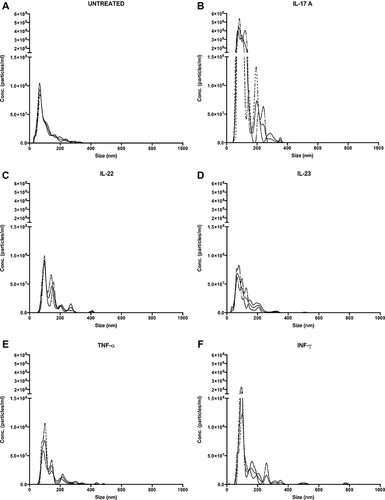
Figure 2 Different cytokine treatments alter mRNA expression of hBD2, hS100A12 and hCAP-18 in HaCaT cells and respective EVs. The mRNA expression of hBD2, hS100A12 and hCAP-18 was evaluated by Real Time RT-PCR in treated HaCaT cells and respective EVs isolated from supernatant. RNA was extracted, retro-transcribed and Real time RT-PCR performed on cellular (A–C) as well as EVs-associated (D–F) total cDNAs as described in Material and Methods section. Data represent means ± s.d. of three independent experiments. ***P ≤ 0.001; **P ≤ 0.01.
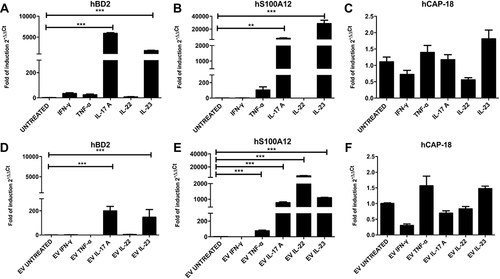
Figure 3 Keratinocyte-derived extracellular vesicles trigger netosis in vitro. (A) Healthy neutrophils were stimulated 3 hours with EV obtained from untreated HaCaTcells (NT) or previously treated with the indicated cytokines. Cells treated with the mitogen phorbol 12-myristate 13-acetate (PMA) is the positive control. Staining of the antimicrobial peptide LL37 was performed with AlexaFluor488-conjugated anti-human LL37 (green), and DNA filaments by a DNA dye (DAPI, blue). Scale bar is 10 µm. White arrows indicate extracellular LL37-DNA colocalizations. One experiment out of three is shown. (B) Neutrophils were treated as in (A). Extracellular traps were first identified as DAPI+ (DNA) filaments associated with LL37, and then the area covered by DNA was quantified on three images per condition. Each dot represents the area covered by the extracellular DNA strand. One representative experiment out of two is shown. Results are shown as mean with standard error of the mean. P-values by Wilcoxon matched-pairs signed rank test.
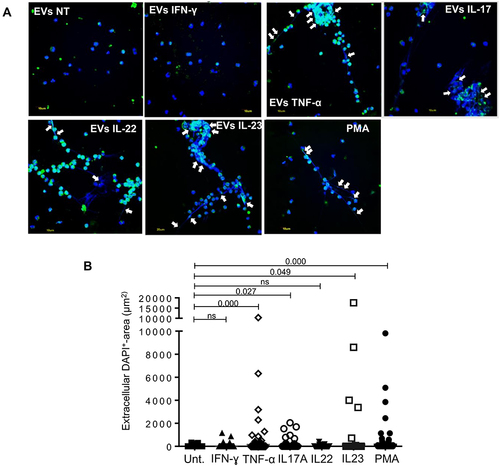
Figure 4 EVs isolated from rIL-17A or rIFNγ treated HaCaT cells can modulate HaCaT migration. (A) HaCat cells were treated with EVs isolated from HaCaT supernatant (EVs UNTREATED), with EVs derived from rIL-17A treated cells (EVs IL-17A) or left untreated (UNTREATED, used as control culture) as described in Materials and Methods. (B) HaCat cells were treated with EVs isolated from HaCaT supernatant (EVs UNTREATED), with EVs derived from rIFN-γ treated cells (EVs IFN-γ) or left untreated (UNTREATED). Data are presented as the mean ± SD of three independent experiments performed in triplicate. ***P ≤ 0.001; **P ≤ 0.01; *P ≤ 0.05.
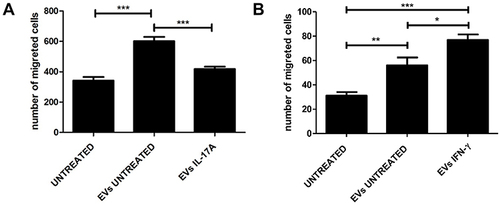
Figure 5 HaCaT EVs can be internalized by SW1353 and SW982 cell lines. EVs were isolated from HaCaT supernatant, stained with PHK67 and incubated with SW1353 (A) and SW982 (B) and cells for different time points. Cells fluorescence was assessed by FACS analysis. Incubation was performed at 37°C (black dots) or, as a negative control, for 6h at +4°C (black square). One representative experiment out of two is shown.
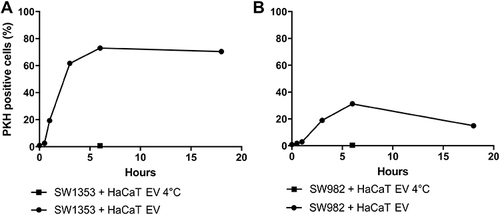
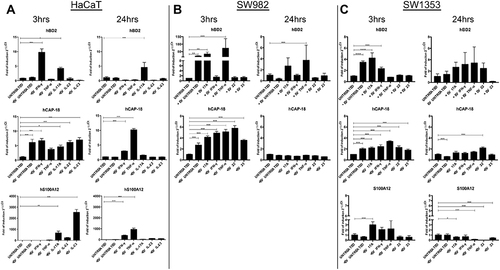
Figure 6 Different cytokine treatments modify the mRNA expression for hCAP-18, hBD2 and hS100A12 in HaCaT acceptor cells. The mRNA expression for hCAP-18, hBD2 and hS100A12 was evaluated in the EV-treated acceptor HaCaT (A), SW982 (B) and SW1353 cells (C) in comparison to untreated acceptor cells by Real Time RT-PCR. Cells were incubated for 3h and for 24h with EVs collected from supernatant of cytokine-treated HaCaT cells. Subsequently, RNA was extracted, retro-transcribed and Real time RT-PCR performed as described in Materials and Methods. Data represent means ± s.d. of three independent experiments. ***P ≤ 0.001; **P ≤ 0.01; *P ≤ 0.05.