Figures & data
Figure 1 Images of the experimental procedures.
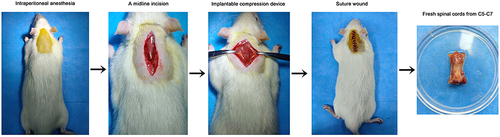
Figure 2 The expression of NLRP3/NeuN in the anterior horn of lesioned spinal cord following compression was analyzed by immunofluorescence. The mean fluorescence intensities of NLRP3 were analyzed by Image J software, and represented as mean gray values. *P<0.05, **P<0.01.
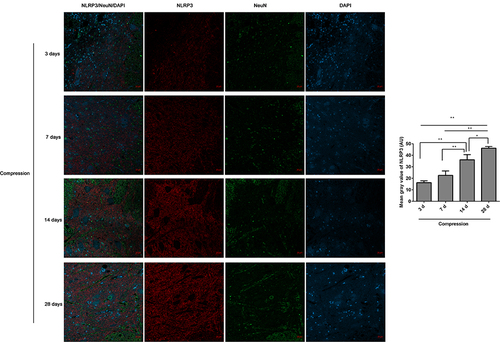
Figure 3 The expression of TNXIP in the lesioned spinal cord following compression was observed. (A) The TNXIP/NeuN expression in the anterior horn of lesioned spinal cords was analyzed by immunofluorescence. The mean fluorescence intensities of TXNIP were analyzed by Image J software, and represented as mean gray values. (B) The TXNIP expression in the lesioned spinal cords was analyzed by Western blot. The gray values of protein bands were analyzed by Image J software, and protein expression was normalized to GAPDH. *P<0.05, **P<0.01.
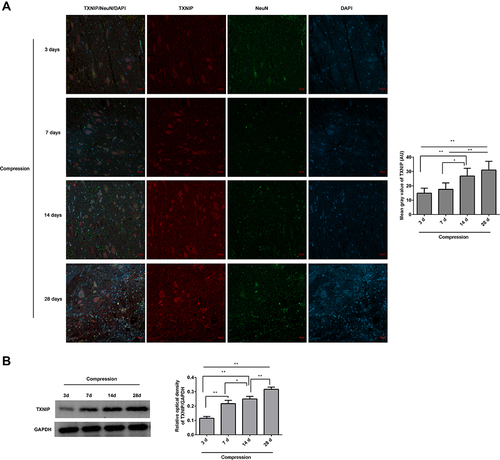
Figure 4 Inhibition of TXNIP improved CSM-induced behavioral deficits. (A) The21-point Basso, Beattie and Bresnahan (BBB) locomotor rating scale; (B) cold allodynia; (C) inclined plane test. Compared with the sham group, **P<0.01; compared with the scrambled group, #P<0.05, ##P<0.01.
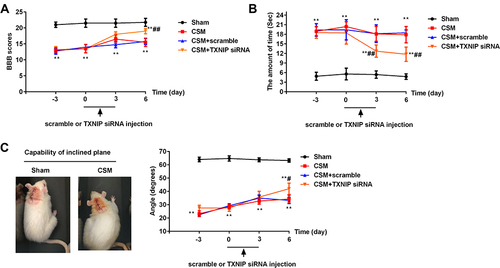
Figure 5 Inhibition of TXNIP reduced apoptosis in the anterior horn of the lesioned area following CSM. (A) Positive TUNEL staining control. (B) Apoptosis in the anterior horn of the lesioned area was analyzed by TUNEL staining. Black arrows show apoptotic cells. Apoptosis rate (%) = the numbers of apoptosis cells/total numbers of cells ×100%. The numbers of cells were counted using Image J software. Compared with the sham group, **P<0.01; compared with the scrambled group, ##P<0.01.
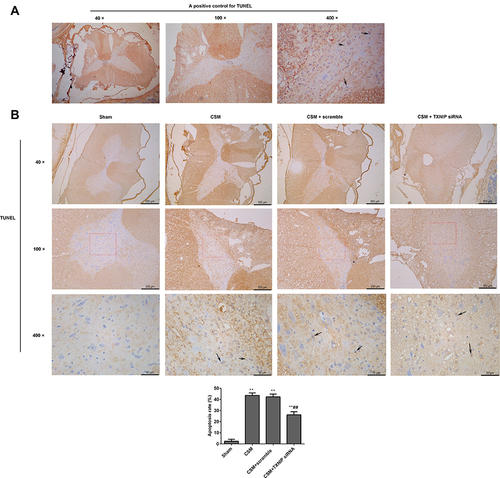
Figure 6 Inhibition of TXNIP declined the TXNIP expression in the anterior horn of the lesioned area following CSM. The mean fluorescence intensities of TXNIP/NeuN were analyzed by immunofluorescence. The mean gray values were analyzed using Image J software. Compared with the sham group, *P<0.05, **P<0.01; compared with the scrambled group, ##P<0.01.
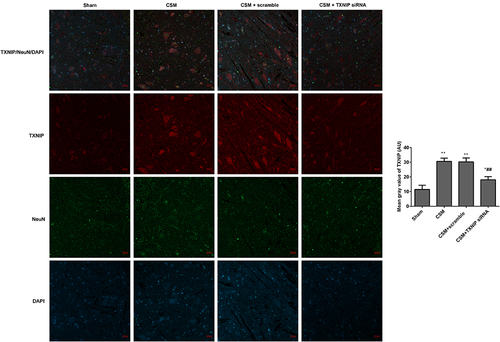
Figure 7 Inhibition of TXNIP declined the NLRP3 expression in the anterior horn of the lesioned area following CSM. The mean fluorescence intensities of NLRP3/NeuN were analyzed by immunofluorescence. The mean gray values were analyzed by Image J software. Compared with the sham group, **P<0.01; compared with the scrambled group, ##P<0.01.
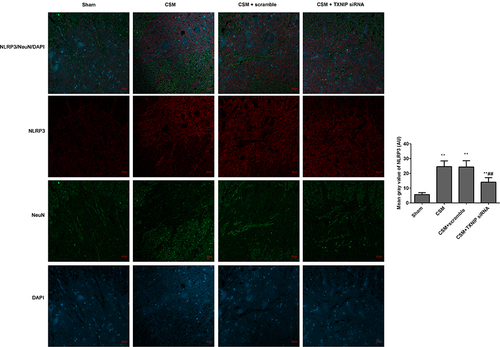
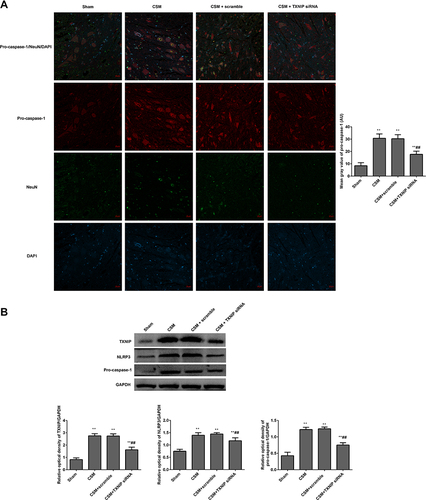
Figure 8 Inhibition TXNIP declined the NLRP3 mediated pro-caspase-1 expression in the anterior horn of the lesioned area following CSM. (A) The mean fluorescence intensities of pro-caspase-1/NeuN were analyzed by immunofluorescence. (B) The expression levels of TXNIP, NLRP3 and pro-caspase-1 in the lesioned spinal cords were measured by Western blot. The mean grays were analyzed by the Image J software. Compared with the sham group, **P<0.01; compared with the scrambled group, ##P<0.01.