Figures & data
Table 1 Contents of SNRS
Figure 1 Animal grouping.
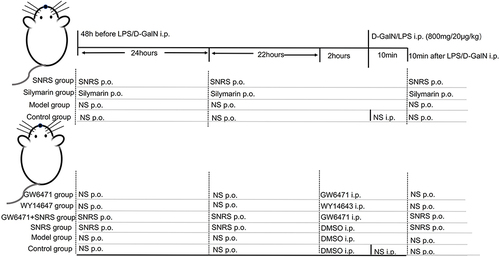
Table 2 Primer Design
Figure 2 Protective effect of SNRS on LPS/D-GalN-induced ALF. Mouse serum was collected at 8 h after LPS/D-GalN injection, and the levels of ALF markers AST (A) and ALT (B) were assessed. (C) Effects of distinct treatments on the 24-hour survival rate of ALF mouse. (D) Hematoxylin and eosin (H & E) staining of mouse liver tissue in different treatment groups, the specimens were examined under microscope (×100 and ×400). (E) The severity of liver tissue sections was graded and scored from 0 to 4. (F) Microscopic changes of LPS/D-GalN attacked hepatocytes (blue arrow: normal mitochondrial structure, clearly visible internal ridge structure, intact mitochondrial membrane; red arrow: mitochondrial swelling and deformation, membrane continuity disruption, ridge disappearance; green arrow: intracellular cytoplasmic loss; purple arrow: discontinuous cell membrane structure; yellow arrow: autophagosome). #Model group compared with control group, #P<0.05, ##P<0.01, ###P<0.001. *Compared to model group, *P<0.05, **P<0.01, ***P<0.01. ΔSNRS group compared with silymarin group, ΔΔP<0.05, ΔΔΔP<0.05.
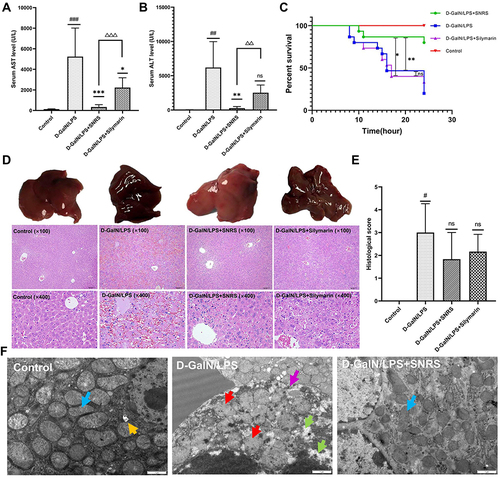
Figure 3 The effect of SNRS on PPARα and necroptosis protein (A) The expression of PPARα mRNA was detected by RT-PCR. (B) The effect of SNRS on PPARα protein expression was measured by Western blotting. (C) Changes in necroptosis-related protein RIP3, MLKL, and p-MLKL with SNRS treatment were measured by Western blotting. #Model group compared with control group, ##P<0.01, ###P<0.001. *SNRS group compared with model group, *P<0.05, **P<0.01.
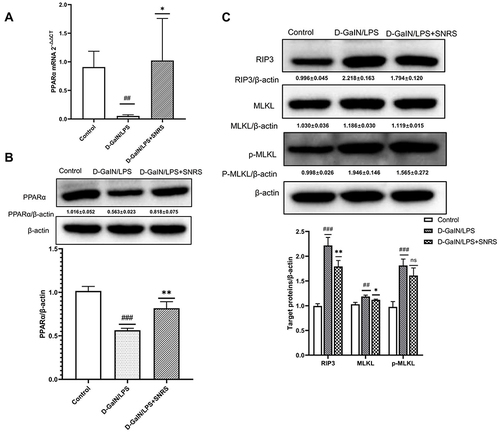
Figure 4 The effect of SNRS on cytokines in the liver tissue of ALF mouse. (A) Mouse serum was collected to detect the cell damage marker HMGB1 by ELISA. Mouse liver tissue was collected, and ELISA was used to evaluate the secretion of cytokines TNF-α (B), TNF-β (C), IL-6 (D), IL-1β (E), and IL-10 (F) in liver tissue. #Model group compared with control group, #P<0.05, ##P<0.01, ###P<0.001. *SNRS group compared with model group, *P<0.05, **P<0.01.
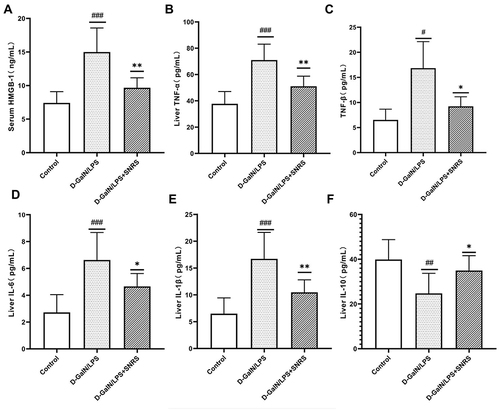
Figure 5 Effects of SNRS on inflammatory signaling pathways. Transcript levels of JNK (A) and TLR4 (B) were detected by RT-PCR. (C) Protein expression of TLR4; (D) Protein expression of p38; (E) Western blotting protein bands of TLR4, P38, JNK2, and P-JNK; (F) Protein expression of JNK2; (G) Protein expression of p-JNK2; (H) NLRP3 levels of liver tissue were determined by ELISA; (I) Protein expression of Casp1; (J) Western blotting protein bands of Casp1 and ASC; (K) Protein expression of ASC; (L) immunohistochemical detection of protein expression of NF-κB. #Model group compared with control group, #P<0.05, ##P<0.01, ###P<0.001. *SNRS group compared with model group, *P<0.05, **P<0.01.
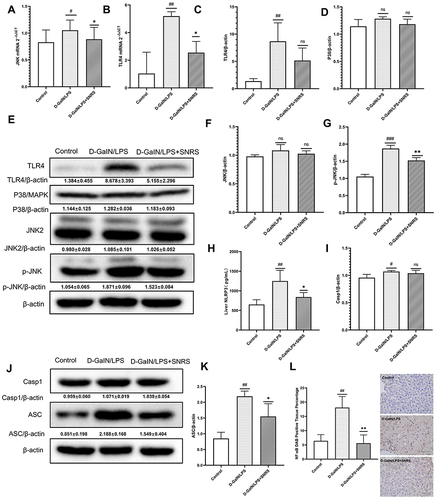
Figure 6 SNRS ameliorates liver injury by promoting the expression of PPARα. (A) The expression of PPARα protein in liver tissue of different treatment groups. (B) The serum level of AST. (C) The serum level of ALT. (D) Gross morphology and HE-stained histological section of the liver. #Model group compared with control group, ##P<0.01, ###P<0.001. *Compared to model group, *P<0.05, **P<0.01, ***P<0.001. ΔGW6471 group compared with GW6471+SNRS group, ΔΔΔP<0.05. @SNRS group compared with WY14643 group, @@P<0.01.
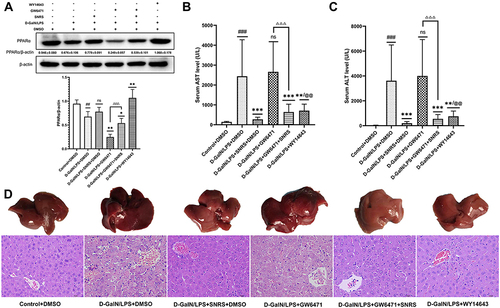
Figure 7 The effect of SNRS on energy metabolism in liver cells of ALF mice. (A) CPT1A mRNA expression; (B) Liver tissue CPT1A in 3 groups was detected by ELISA; (C) Liver tissue CPT1A in 6 groups was detected by ELISA; (D) ADP level in the liver of mice; (E) ATP level in the liver of mice; (F) ADP/ATP ratio in the liver of mice. #Model group compared with control group, #P<0.05, ##P<0.01, ###P<0.001. *Compared to model group, *P<0.05, **P<0.01, ***P<0.001. ΔGW6471 group compared with GW6471+SNRS group, ΔP<0.05.
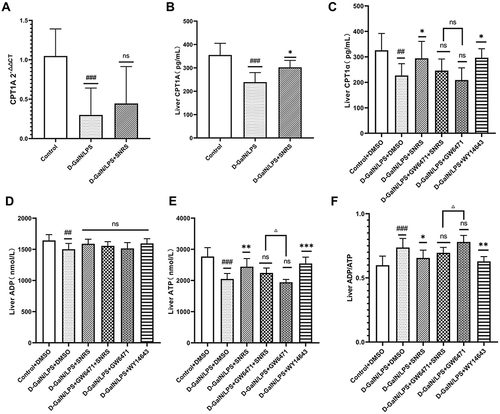
Figure 8 SNRS inhibits hepatocyte necroptosis by promoting PPARα. #Model group compared with control group, #P<0.05, ##P<0.01. *Compared to model group, *P<0.05. ΔGW6471 group compared with GW6471+SNRS group, ΔΔΔP<0. 001.
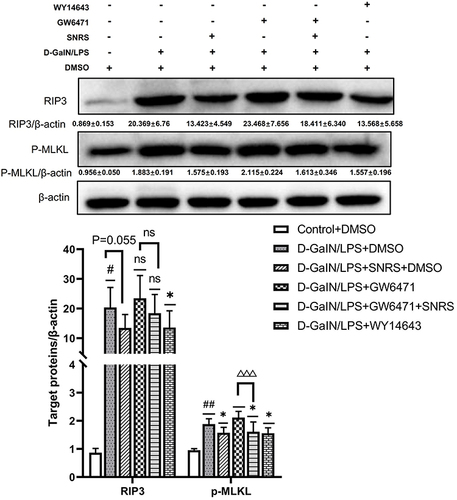
Figure 9 SNRS attenuates oxidative stress and inflammation in liver tissue. Changes in cytokines TNF-α (A), TNF-β (B), IL-1β (C), IL-6 (D), and IL-10 (E) in liver tissue with different drug treatments. Changes in oxidative stress-related indexes MDA (F), SOD (G), and GSH (H) in liver tissue with different drug treatments. #Model group compared with control group, ###P<0.001. *Compared to model group, *P<0.05, **P<0.01, ***P<0.001. ΔGW6471 group compared with GW6471+SNRS group, ΔP<0.05, ΔΔP<0.01.
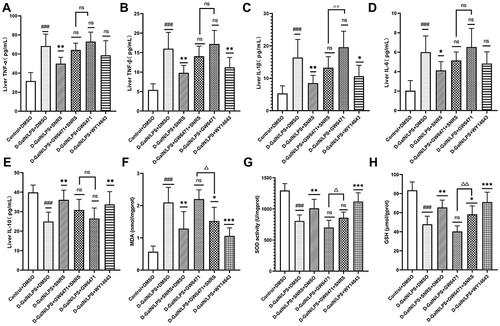
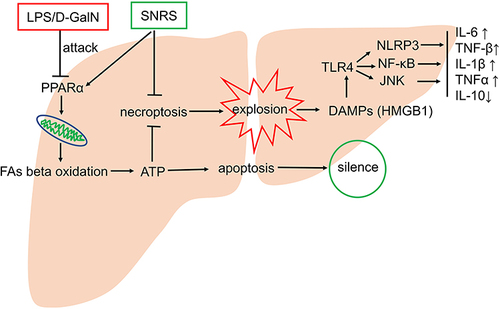
Figure 10 Possible mechanisms of SNRS in the treatment of ALF.