Figures & data
Figure 1 QSG improved cardiac function in mice after AMI. (A) Experimental protocol for QSG studies in AMI mice. Experimental protocol for QSG studies in AMI mice, LAD ligation was used to made AMI model in mice after 3 d of adaptive feeding, QSG were administered by oral gavage, and NLRP3 inhibitor (MCC950) by intraperitoneal injection from 4 d - 7 d, subsequent cardiac echocardiography and acquisition of relevant parameters. (B) Representative echocardiographic images of mice in each group and analysis of LVEF, LVFS, LVAW; d, LVAW; s, LVPW; d, LVPW; s, LVID; d, LVID; s levels after QSG treatment. (C) ELISA of plasma CKMB and cTnI levels. N = 6 per group. ###P < 0.001 vs sham group, *P < 0.05, **P < 0.01, ***P < 0.001 vs model group.
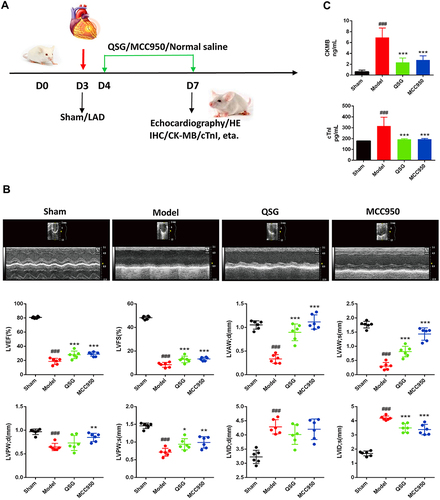
Figure 2 QSG attenuated myocardial tissue inflammatory injury in AMI mice. (A) Representative heart images for each group of HE staining, Scale bar=20 µm. N = 3 per group. (B and C) IHC of IL-18 and IL-1β images of AMI mice in each group and analysis, Scale bar=20 µm. N = 3 per group. (D) ELISA results of IL-1β and IL-18 in cardiac tissue homogenates. N = 6 per group. ###P < 0.001 vs sham group, ***P < 0.001 vs model group.
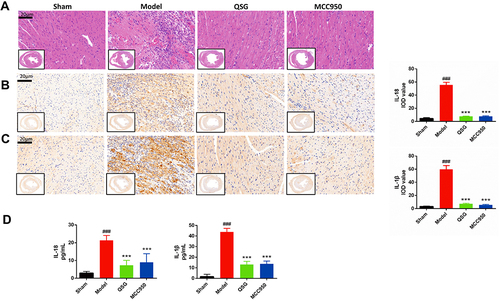
Figure 3 QSG inhibited NLRP3 inflamat some activation in cardiac tissue macrophages. (A) Representative NLRP3/ASC/Caspase-1 immunofluorescent staining images of AMI mice in each group. Scale bar=20 µm. (B) Representative CD86/Caspase-1 immunofluorescent staining images of AMI mice in each group. Scale bar=20 µm. (C–I) Western blot analysis showed that QSG treatment reduced the expression of P2X7R, NEK7, NLRP3, ASC, Caspase-1, IL-18, IL-1β in cardiac tissue macrophages. Proteins had been normalized to GAPDH, N = 6 per group. ###P < 0.001 vs sham group, ***P < 0.001 vs model group.
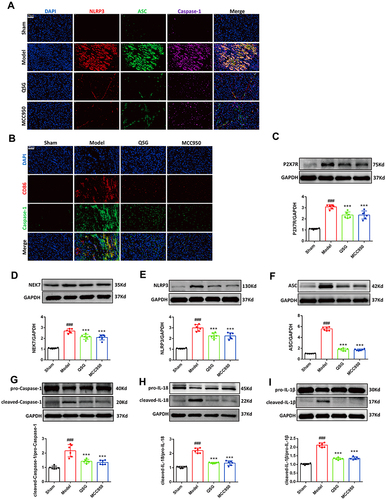
Figure 4 QSG inhibited LPS combined with ATP-induced NLRP3 inflammasome activation in RAW264.7 macrophages. (A) Establishment of LPS combined with ATP to induce NLRP3 inflammasome activation model. (B) Immunofluorescence determined that LPS in combination with ATP activates NLRP3 inflammasome. Scale bar=75 µm. (C) Safe concentration of QSG in RAW264.7 macrophages. (D) Experimental protocol for QSG in LPS combined with ATP to induce NLRP3 inflammasome activation in RAW264.7 macrophages. (E) Effective concentration of QSG in RAW264.7 macrophages. (F) MCC950 inhibitor concentration range in RAW264.7 macrophages. (G–M) Western blot analysis showed that QSG treatment reduced the expression of P2X7R, NEK7, NLRP3, ASC, Caspase-1, IL-18, IL-1β in RAW264.7 macrophages. N = 3 per group. ##P < 0.01, ###P < 0.001 vs sham group, *P < 0.05, **P < 0.01, ***P < 0.001 vs model group.
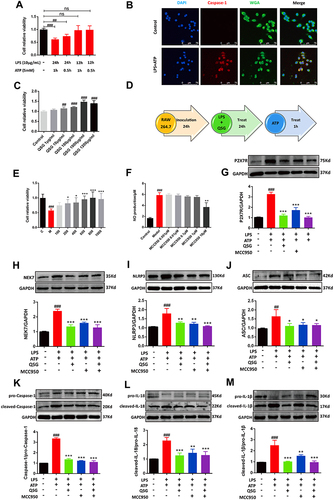
Figure 5 QSG inhibited the P2X7R-NEK7-NLRP3 inflammasome pathway. (A) Determination of potassium ion concentration in RAW264.7 macrophages supernatant. (B) The effective concentration range of CCK8 to detect AZ. (C) Representative graph of optimal concentration of AZ for WB validation. (D) Representative immunofluorescence detection images of RAW264.7 macrophages P2X7R expression. Scale bar=25 µm. (E–H) Western blot analysis showed that both QSG and AZ treatment reduced the expression of P2X7R, Caspase-1, IL-18, IL-1β in RAW264.7 macrophages, N = 3 per group. ###P < 0.001 vs sham group, *P < 0.05, **P < 0.01, ***P < 0.001 vs model group.
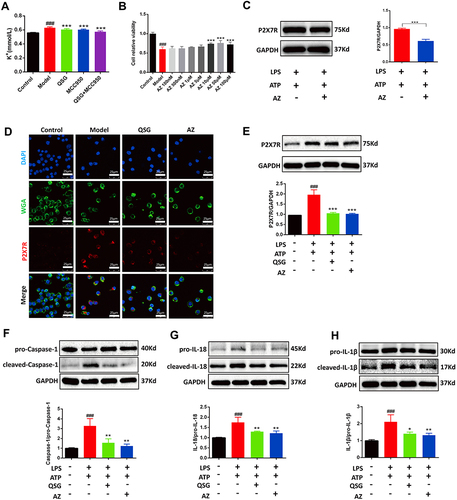
Figure 6 QSG regulates the P2X7R-NEK7-NLRP3 pathway. (A) mP2X7R pcDNA3.1–3xFlag-T2A-EGFP map. (B) WB images of images of RAW264.7 macrophages and analysis of P2X7R. (C) Representative immunofluorescence detection images of Caspase-1. Scale bar=75 µm. (D and E) Western blot images of RAW264.7 macrophages and analysis of IL-18 and IL-1β. (F–H) RAW264.7 macrophages were transfected with P2X7R pcDNA3.1 followed by immunoprecipitation and immunoblot using NEK7 antibody to analyze the protein expression levels of NEK7, NLRP3. The Input represents total protein extracts used for immunoprecipitation. GAPDH was used as a loading control. IB, immunoblot. IP, immunoprecipitation. IgG, negative control. ###P < 0.001 vs pcDNA3.1 group, **P < 0.01, ***P < 0.001 vs P2X7R pcDNA3.1 group.
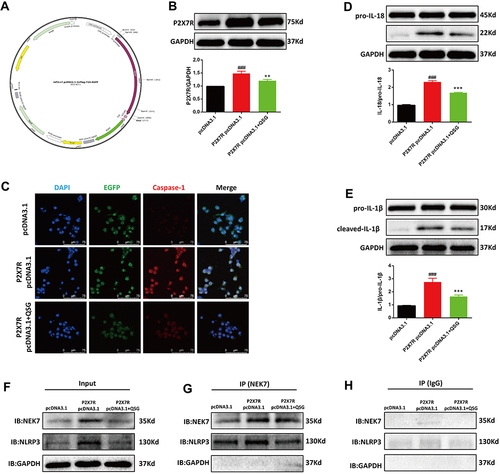
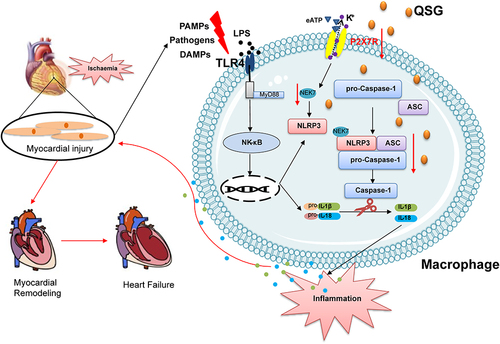
Figure 7 QSG might protect AMI through the P2X7R-NEK7-NLRP3 pathway.