Figures & data
Figure 1 Enhanced cGAS-STING pathway and inflammatory factor levels in patients with endometritis. (A) The protein levels of the cGAS-STING pathway by Western blot in indicated groups. (B) Quantitative analysis of (A). (C) The protein levels of STING by IHC in indicated groups and their quantitative analysis. (D) The relative mRNA levels of IL-8, IL-1β, IL-6 and IFN-β1 by RT-PCR in indicated groups. (*p < 0.05, **p < 0.01, ***p < 0.001).
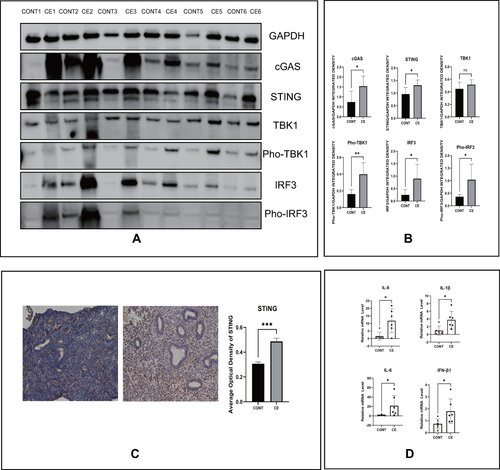
Figure 2 LPS induces the production of inflammatory factors involved in cGAS-STING pathway activation in HESCs. (A) The relative mRNA levels of IL-8, IL-1β, IL-6 and IFN-β1 by RT-PCR in indicated groups of HESCs. (B) The protein levels of the cGAS-STING pathway by Western blot in indicated groups of HESCs. (C) Quantitative analysis of (B). (D) The relative mRNA levels of IL-8, IL-1β, IL-6 and IFN-β1 by RT-PCR in indicated groups of HESCs. (*p < 0.05, **p < 0.01, ***p < 0.001, ***p < 0.0001).
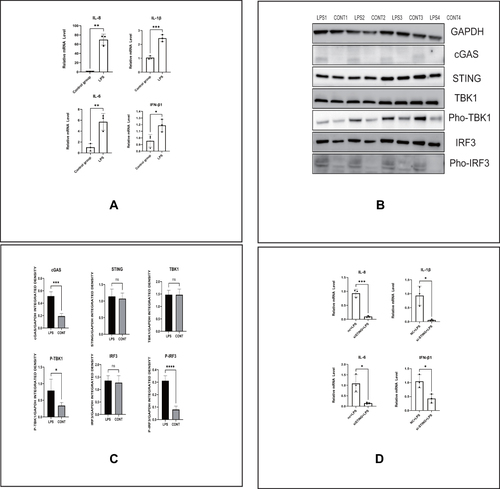
Figure 3 LPS induces STING undergoing perinuclear transfer and IRF3 transferring from the cytoplasm to the nucleus. (A) Representative images of immunofluorescence of STING in indicated groups of HESCs. (B) Representative images of immunofluorescence of IRF3 in indicated groups of HESCs. (C) The protein levels of IRF3 in cytoplasm and nucleus of HESCs in indicated groups by Western blot. (D) The protein levels of IRF3 in cytoplasm and nucleus of HESCs in indicated groups by Western blot. (E) Quantitative analysis of (C and D). (*p < 0.05).
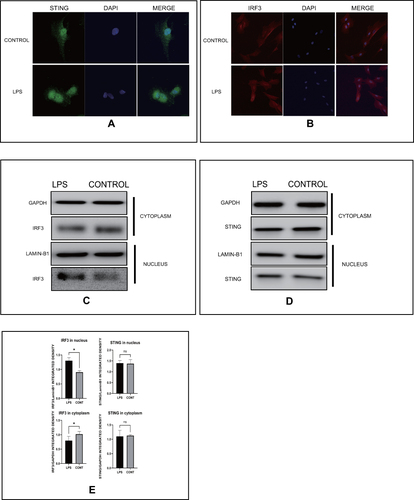
Figure 4 LPS activates the cGAS-STING pathway by inducing mitochondrial dysfunction. (A) Representative images of immunofluorescence of ROS (red) indicated groups of HESCs. (B) Representative images of immunofluorescence of MMP (red and green) indicated groups of HESCs. (C) Representative images of DAPI (blue), mitochondria (red), and dsDNA (green) in indicated groups of HESCs, p<0.05. (D) The protein level of the cGAS-STING pathway by Western blot in indicated groups of HESCs. (E) Quantitative analysis of (D). (*p < 0.05).
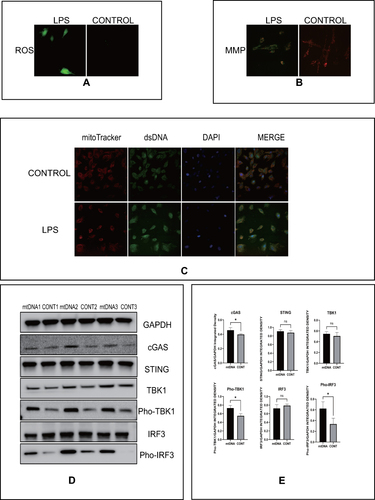
Figure 5 Intrauterine infusion of LPS induces uterine hyperemia and cGAS-STING pathway activation in mice. (A) Representative images of the uterus of mice after intrauterine infusion in indicated groups. (B) The relative mRNA levels of IL-8, IL-1β, IL-6, and IFN-β1 by RT-PCR in indicated groups of the uterus of mice (LPS: 12 h). (C) Quantitative analysis of (B). (D) The protein levels of TBK1 and Pho-TBK1 (LPS: 6 h). (E) Quantitative analysis of (D). (*p < 0.05).
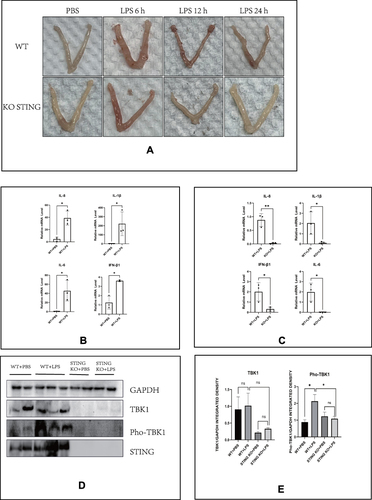
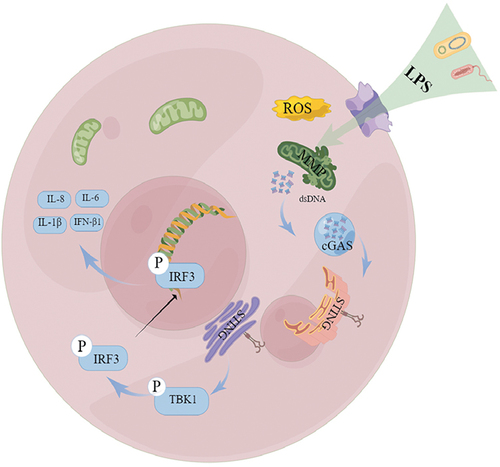
Figure 6 A putative scheme explaining the mechanism by which mitochondrial dysfunction, mtDNA leakage, and cGAS-STING pathway regulate endometritis induced by LPS.