Figures & data
Figure 1 TFDG attenuated the arthritis of CIA mice. (A) Construction and treatment of collagen-induced arthritis in DBA/1 mice. (Low-TFDG: 1mg/kg/day, High-TFDG: 10mg/kg/day.) (B) The paw pictures of DBA/1 normal and CIA mice. (C) Mean paw thickness and mean arthritis score were recorded from the third week. (#p<0.05: compared with the Sham group; &p<0.05 and ^p<0.05: compared with the vehicle group). (D) 3D reconstruction of paw after Micro-CT scan. (E) Bone volume (BV, mm3), bone surface area to bone volume (BS/BV, mm−1), trabecular thickness (Tb. Th, mm), bone volume/tissue volume (BV/TV, %). (The number of mice in each group was 8. *p<0.05 and **p<0.01: compared with the vehicle group).
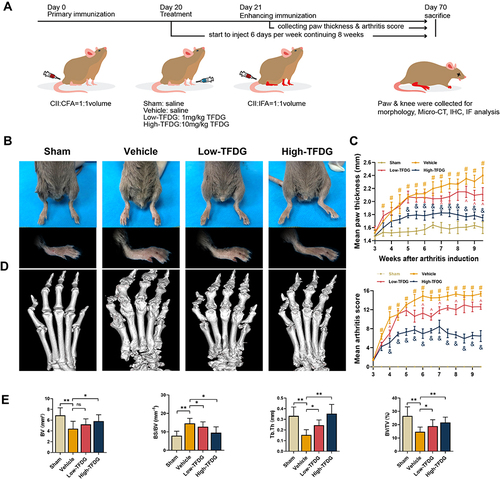
Figure 2 TFDG reduced the inflammatory cytokines in vitro. (A) 2D structure of TFDG. (B) Cell viability of BMMs treated with 0, 0.01, 0.1, 1, 10 and 20μM of TFDG for 1day, 4days and 7days. (n=5 per group) (**p<0.01 compared with 1day OD value.) (C–E) IL-6, IL-1β and IL-10 of BMMs supernatant were analyzed with ELISA. (n=5 per group) (F–H) IL-6, IL-1β and IL-10 of BMMs were analyzed with Real-time quantitative PCR. (n=5 per group.) (**p<0.01 compared with the TNF-α group).
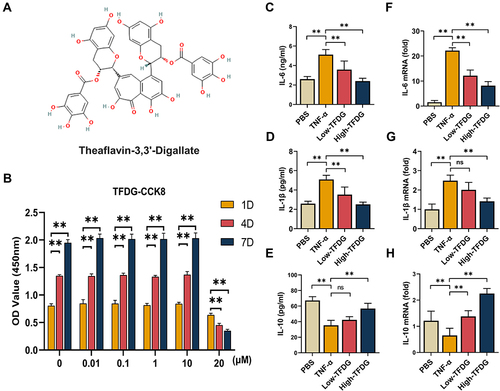
Figure 3 TFDG reduced the inflammatory cytokines in vivo. (A) Immunohistochemistry staining of TNF-α and IL-1β in CIA mice. (The red arrows point to positive cells. Scale bar: 50μm.) (B and C) Quantitative analysis of the number of positive cells in immunohistochemistry staining. (D–G) ELISA analysis of TNF-α, IL-1β, IL-6 and IL-10 in peripheral blood. (*p<0.05 and **p<0.01 compared with the vehicle group, n=8 each group).
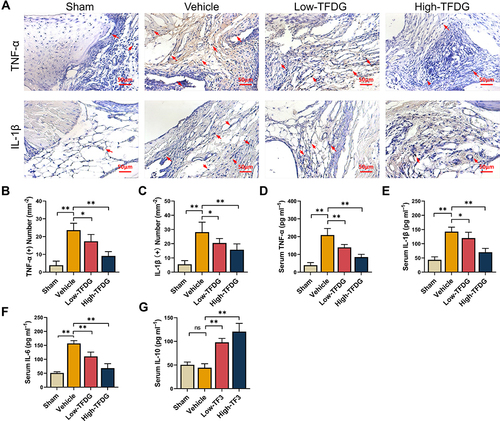
Figure 4 TFDG ameliorated the joint destruction. (A) H&E staining and (B) safranin-O/fast green staining of the knee joint of CIA mice. (Scale bar: 100μm) (C) Erosion score. (D) Cartilage OARSI score. (E) Infiltrate score. (F) Quantitative analyses of the relative inflammatory area of the knee joint. (*p<0.05 and **p<0.01 compared with the vehicle group, n=8 per group).
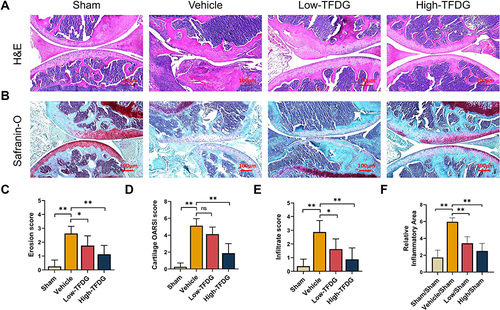
Figure 5 TFDG regulated macrophage polarization in vitro. (A) Immunofluorescence staining of F4/80(+)iNOS(+) macrophages. (B) Immunofluorescence staining of F4/80(+)Arg-1(+) macrophages. (C) Quantitative analyses of the positive cell number. (*p<0.05 and **p<0.01 compared with the TNF-α group; n=3 each group) (D) Real-time quantitative PCR analysis of iNOS and Arginase-1 mRNA level. (*p<0.05 and **p<0.01 compared with the TNF-α group, n=5 each group).
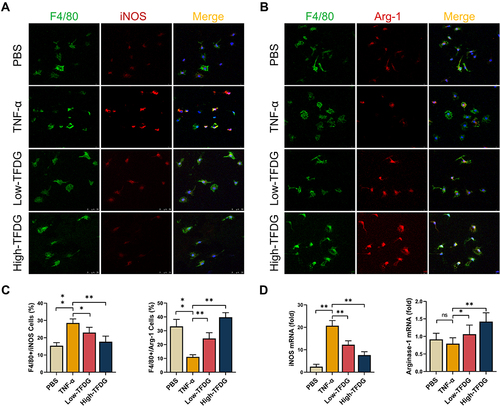
Figure 6 TFDG regulated macrophage polarization in CIA mice. (A and B) Immunofluorescence staining of F4/80(+)CD86(+) and F4/80(+)CD206(+) macrophages. (Scale bar: 100μm and 50μm.).
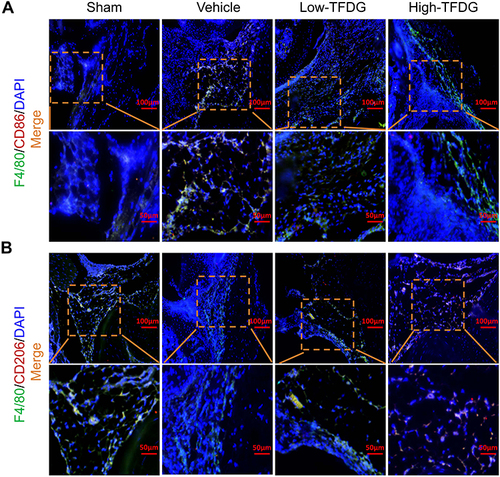
Figure 7 Prediction of TFDG targets and protein–ligand docking. (A) Intersection of GSE10500, GSE49604, GSE97779 and the results of Swiss Target Prediction of TFDG. (B) The intersection results were ranked by binding probability with TFDG.(Yellow bar chart presented the probability of combination between TFDG and proteins.) (C and D) Formation of hydrogen bond between TFDG and Bcl-2 residues. Showed in (C) was top1 binding conformation of TFDG with minimum binding energy. (D) was another 3 conformation of top4 with minimum binding energy. (yellow: top1, red: top2, green: top3, blue: top4.).
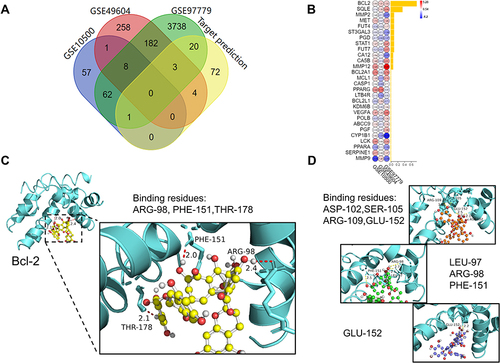
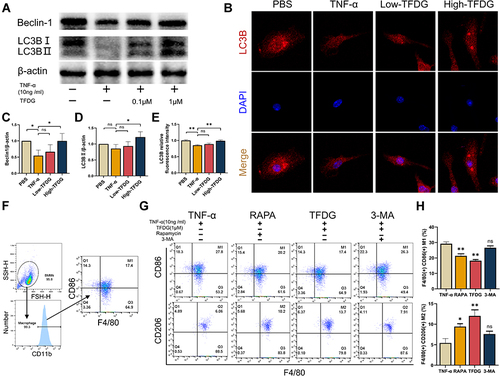
Figure 8 TFDG regulated macrophage polarization via autophagy. Before 10ng/mL TNF-α treatment for 4h, low and high concentration of TFDG (0.1 and 1.0μM) were separately added to the low and high TFDG groups for 2hours. (A) The Western blot analysis of Beclin-1, LC3B and β-actin (internal reference). (B) Immunofluorescence of the LC3B in BMMs. (C and D) Quantitative analysis of the gray level of Beclin-1 and LC3B bands. (E) Quantitative analysis of LC3B fluorescence intensity. (F) M1 and M2 macrophage sorting process with flow cytometry. (G and H) F4/80(+)CD86(+) and F4/80(+)CD206(+) macrophages were analyzed. (*p<0.05 and **p<0.01 compared with the TNF-α group, n=3 each group).