Figures & data
Table 1 Primer Sequences Used for Real Time-PCR
Figure 1 Over expression of COX-2 in pancreatic tissue of mice following treatment with 20% L-arginine to induce CP. (A and B) H&E and Masson’s trichrome staining in the pancreas following L-arginine treatment (original magnification: 200×). (C) The expression of COX-2 in the pancreas by IHC staining (original magnification: 400×). (D) COX-2 protein expression in pancreatic tissues as detected by Western blot. β-actin served as a loading control (representative blot). (E and F) Double-labeled immunofluorescence of incorporated COX-2 and CK-19 (E) or COX-2 and F4/80 (F). COX-2 showed green, CK-19 or F4/80 showed red (Original magnification, 400×).
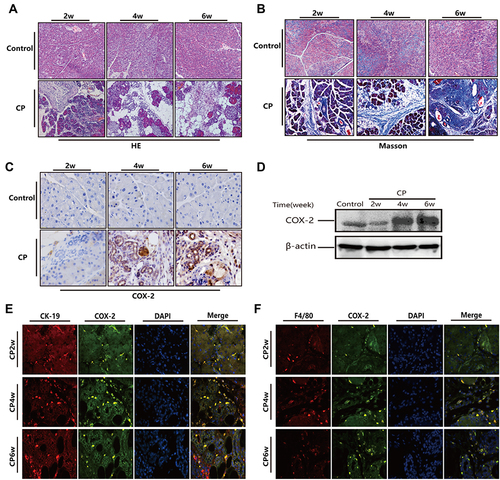
Figure 2 Aspirin inhibits the expression of COX-2 in mice with chronic pancreatitis induced by L-arginine. (A) Schematic diagram of animal experiment with 20% L-arginine induced CP. (B) COX-2 protein expression in pancreatic tissues was detected by Western blot. β-actin served as a loading control (representative blot). (C) COX-2 mRNA expression in pancreas was determined by real time PCR. Fold change values were normalized to β-actin mRNA (each group, n=6). Compared with control: **P<0.01; Compared with CP model group: ΔP<0.05, ΔΔP<0.01. (D) The expression of COX-2 in pancreas by immunohistochemistry staining (original magnification: 200×).
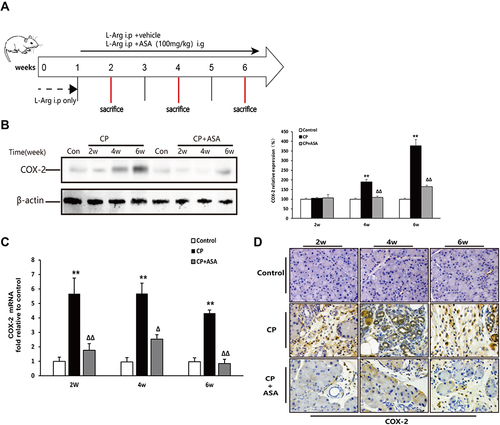
Figure 3 Histopathological changes in experimental CP mice and aspirin treatment. (A) Ratio of pancreatic/body weight (n=6). (B) H&E staining in the pancreas of the CP models induced by L-arginine (original magnification: 100×). Histological scoring of edema, inflammation, fibrosis, and acinar atrophy was performed as described in methods. Values are expressed as mean ± SD (n = 6). (C) The amylase level in serum at different time-points. Results are expressed as mean ± SD (n = 6). (D) IHC staining for amylase in the pancreas (original magnification: 400×) and morphometric analysis. (E) Immunohistochemistry staining for CK-19 in pancreas (original magnification: 400×) and morphometric analysis. *P<0.05, **P<0.01 vs control group; ΔP <0.05, ΔΔP <0.01vs. CP group.
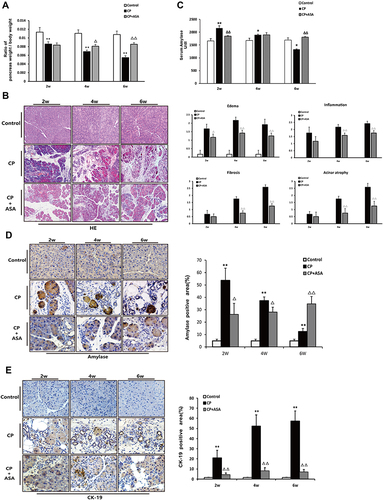
Figure 4 Aspirin attenuates inflammatory infiltration in the pancreas of mice treated with 20% L-arginine. (A) IHC staining for F4/80 in pancreas (original magnification: 200×) and F4/80 positive cell count analysis. (B) MCP-1 and (C) IL-6 mRNA expression was analyzed by RT-PCR, fold changes were normalized to β-actin mRNA. Results were expressed as Mean±SD (each group, n=6). **P<0.01 vs control group; ΔP<0.05, ΔΔP<0.01vs. CP group. (D) IHC staining for CD3 in pancreas (original magnification: 200×) and CD3 positive cell count analysis.
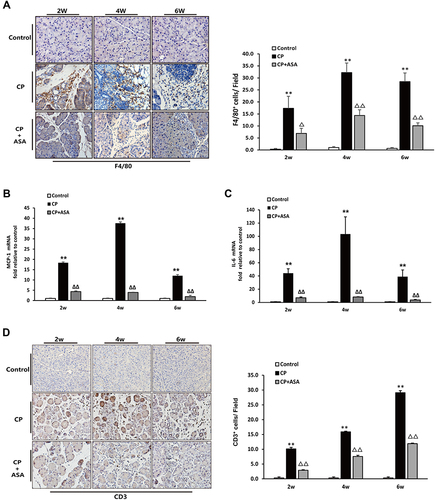
Figure 5 Aspirin inhibits pancreatic fibrosis in pancreas of mice treated with 20% L-arginine. (A) Masson’s trichrome staining (original magnification: 100×), histograms showing the quantitative analysis of the % fibrotic area. (B) COL1A1 protein level in pancreatic tissues was detected by Western blot. β-actin served as loading control (representative blot). The relative protein abundance was quantified through densitometry analysis normalized against β-actin. (C and D) MMP-1 and TIMP-1 mRNA expression were determined by real time PCR. Fold change values were normalized to β-actin mRNA (each group, n=6). Results are expressed as mean ± SD. Compared with control: *P<0.05, **P<0.01; Compared with CP model group: ΔP<0.05, ΔΔP<0.01.
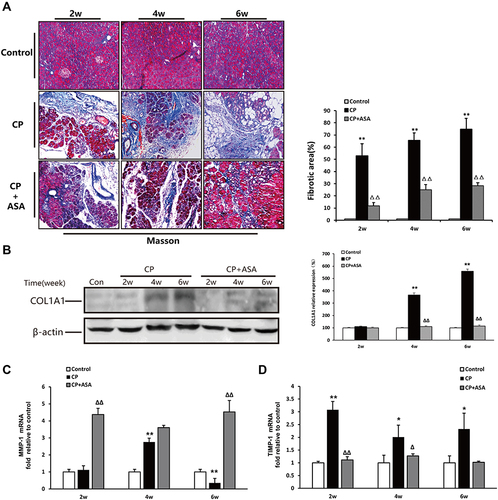
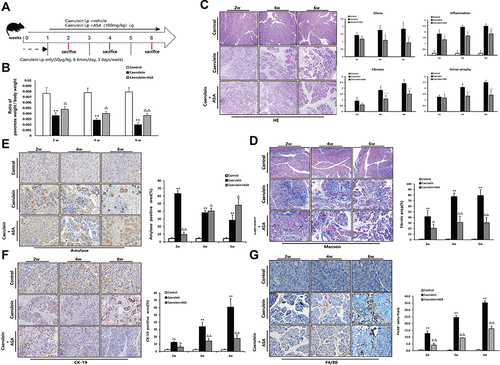
Figure 6 Aspirin attenuates caerulein-induced chronic pancreatic injury in C57BL/6 mice. (A) Schematic showing the experimental design of aspirin treatment of caerulein-induced CP in C57Bl/6 mice. (B) Ratio of pancreatic/body weight (n=6). (C) H&E staining in the pancreas of the CP models induced by caerulein (original magnification: 100×). Values of histological scoring were expressed as mean ± SD (n = 6). (D) Masson’s trichrome staining (original magnification: 100×), histograms showing the quantitative analysis of the % fibrotic area. (E) IHC staining for amylase in pancreas (original magnification: 400×) and morphometric analysis. (F) IHC staining for CK-19 in pancreas (original magnification: 400×) and morphometric analysis. (G) IHC staining for F4/80 in pancreas (original magnification: 400×) and morphometric analysis. **P<0.01 vs control group; ΔP<0.05, ΔΔP<0.01 vs CP group.