Figures & data
Figure 1 DPY30 expression in melanoma. (A) DPY30 gene copy number in Haqq melanoma vs normal tissues. (B) Comparison of DPY30 expression in primary and metastatic melanoma. (C) DPY30 expression in different cancers and normal tissues in TCGA data. (D) DPY30 gene expression and mutation analysis in SKCM. (E) The distribution of DPY30 genomic alterations in SKCM. (F) The graph of the correlation between DPY30 expression and copy number alterations in SKCM. (G) Kaplan–Meier curve of OS in SKCM patients with altered (red) and unaltered (blue) DPY30 gene. *P< 0.05, **P< 0.01, ***P< 0.001.

Figure 2 DNA methylation and its correlation with DPY30 expression. (A) Correlation analysis of DPY30 mRNA expression with DPY30 promoter methylation status by the UALCAN database. (B) The methylation levels of DPY30 gene promoter region were compared in TNM stage from UALCAN database. (C) The methylation levels of DPY30 gene promoter region were compared in N stage from UALCAN database. (D) DNA methylation of the DPY30 promoter region in TCGA-SKCM dataset. *P< 0.05, **P< 0.01, ***P< 0.001.
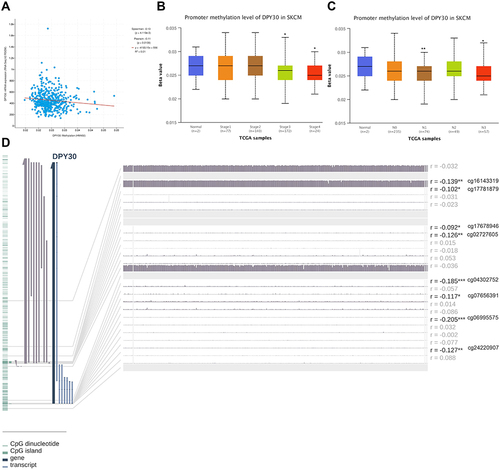
Figure 3 DPY30 expression is related to ICP, TMB, and neoantigen. (A) Correlations of DPY30 expression with ICP genes (CD274, CTLA4, CD160, HAVCR2, IDO2, and PDCD1LG2) involved in T-cell exhaustion. (B) The relationship between DPY30 expression and TMB. (C) The relationship between DPY30 expression and neoantigen.
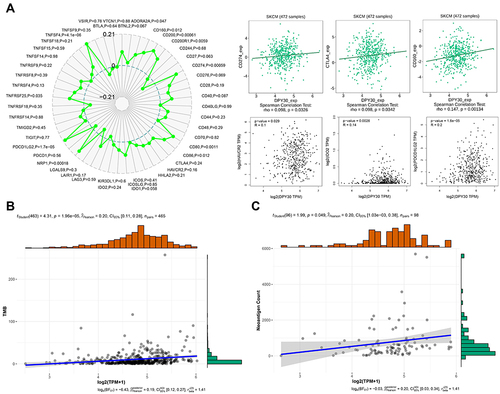
Figure 4 Correlations of DPY30 with immune infiltration level in SKCM. (A) Correlations of DPY30 expression with immunosuppressive cells and markers of (MDSCs, TAMs, and Tregs). (B) Correlation between DPY30 expression and chemokines.
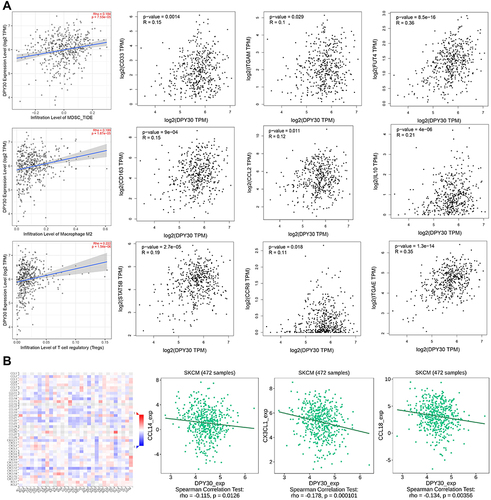
Table 1 Correlation Between the Expression of DPY30 and PD-L1
Figure 5 The expression of DPY30 correlates with PD-L1 in human melanoma tissues. (A and B) Spearman correlation analysis of DPY30 expression with CD274 expression. (C) Representative IHC staining of DPY30 and PD-L1 in the same melanoma tissue. Red arrows point to the location of DPY30 protein and PD-L1 protein.
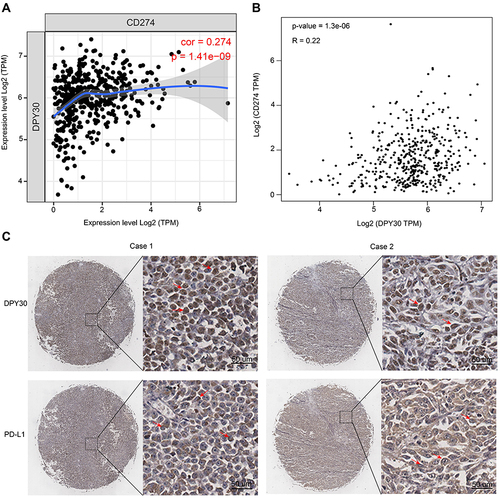
Figure 6 Function of DPY30 in regulation of PD-L1 expression. (A and B) MMAC-SF cells were transiently transfected with DPY30-specific SiRNA, and the protein levels of DPY30 and PD-L1 were analyzed by Western blotting, and the mRNA levels of DPY30 and PD-L1 were detected by RT-PCR. (C) The H3K4me3 levels in the PD-L1 promoter region in MMAC-SF and WM-115 cell lines were analyzed by ChIP. (D and E) MMAC-SF cells and MMAC-SF Si-DPY30 cells were treated with IFN-γ at the prescribed dose for 24 h or 48h, and analyzed for PD-L1 mRNA level by RT-PCR. (F and G) MMAC-SF cells and MMAC-SF Si-DPY30 cells were treated with IFN-γ at the prescribed dose for 24 h or 48h, stained with PD-L1 specific MAb, and analyzed by flow cytometry. **P< 0.01.
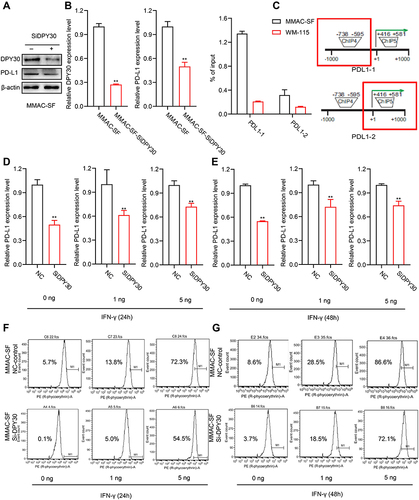
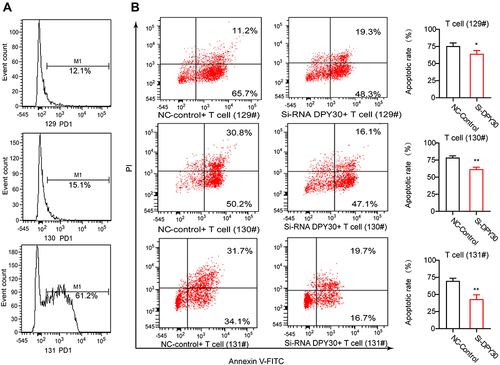
Figure 7 Knockdown of DPY30 in MMAC-SF cells inhibited T cell apoptosis. (A) The PD1+ level in human T cells from 3 normal samples were analyzed by flow cytometry. (B) Flow cytometry was used to analyze the apoptosis of T cells in the co-culture model with MMAC-SF cells and PD1+ T cells. *P< 0.05, **P< 0.01. #Indicates the sample number.