Figures & data
Figure 1 General pathological changes in AIA rats. (A) Dynamic changes of body weight and arthritis score throughout the observational period; (B) relative weight index of tissues and organs; (C) levels of FFA and NOX in blood plasma of rats. Statistical significance: *p < 0.05 and **p < 0.01 compared with normal healthy rats.
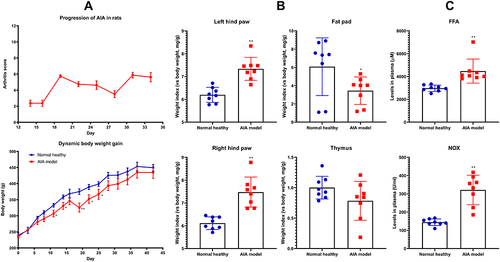
Figure 2 Status of SIRT1 signaling in AIA rats. (A) Dynamic changes in expression of SIRT1 and related genes in WBC throughout the observational period; (B) correlation relationship among expression of the tested genes; (C) scatter diagram exhibiting the expression correlation between IL-10 and SIRT1; (D) expression of protein SIRT1 in circulating monocytes when the rats were killed. Statistical significance: *p < 0.05 and **p < 0.01 compared with normal healthy rats.
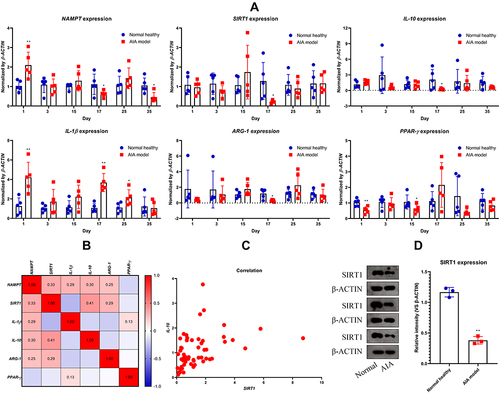
Figure 3 Changes occurred in AIA rats during RSV treatment. (A) Schematic diagram about the experimental arrangement; (B) dynamic changes of body weight and arthritis score throughout the observational period; (C) periodic changes in levels of oxidative stress indicators (MDA, SOD and GSH) and IL-10 in rat blood. Statistical significance: *p < 0.05 and **p < 0.01 compared with normal healthy rats; #p < 0.05 and ##p < 0.01 compared with AIA model rats.
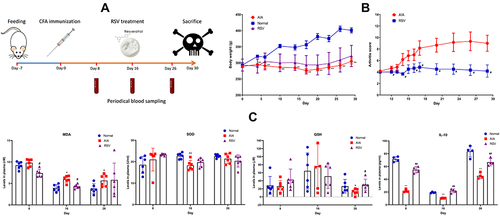
Figure 4 Overall effects of RSV therapy on AIA in rats. (A) Levels of IL-1β in blood plasma from different rats sampled on day 16; (B) levels of RA diagnostic indicators (IL-6, anti-CCP, RF and CRP) in plasma from different rats sampled on the day when the rats were sacrificed; (C) levels of metabolites (triglyceride, glucose, lactate and pyruvate) in the same batch of plasma used in assay C; (D) expression of PKM1 in rat livers; (E) relative weight index of tissues and organs; (F) pathological changes occurred in paws and ankle joints (assessed by morphological and HE-staining based histological examinations, arrow: cartilage degradation). Statistical significance: *p < 0.05 and **p < 0.01 compared with normal healthy rats; #p < 0.05 and ##p < 0.01 compared with AIA model rats.
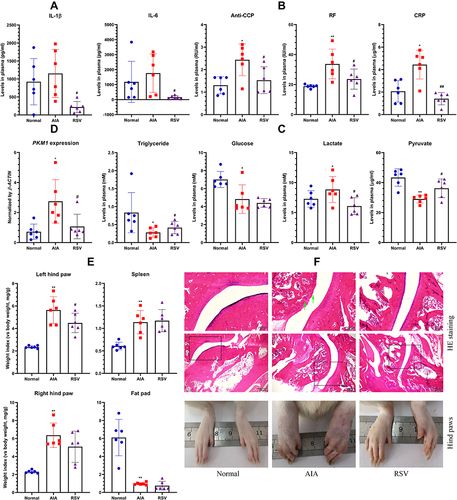
Figure 5 The effects of SIRT1 up-regulation on AIA monocytes in vitro. (A) Levels of IL-10 in culture medium from normal and AIA monocytes in the presence of RSV or not; (B) expression of gene SIRT1 and PKM1/2 in the cells from assay A; (C) levels of pyruvate and lactate in culture medium from normal monocytes, AIA monocytes and AIA monocytes overexpressing SIRT1; (D) levels of IL-10 in the medium from assay C; (E) ATP concentrations in the cells from assay C; (F) expression of protein TPI1, HIF-1α, p-AMPK, AMPK, p-STAT3, STAT3, and SIRT1 in the cells from assay C; (G) quantified results of assay F; (H) expression of gene TPI1, TGM2 and c-MAF in the cells from assay C. Statistical significance: *p < 0.05 and **p < 0.01 compared with normal monocytes; #p < 0.05 and ##p < 0.01 compared with untreated AIA monocytes.
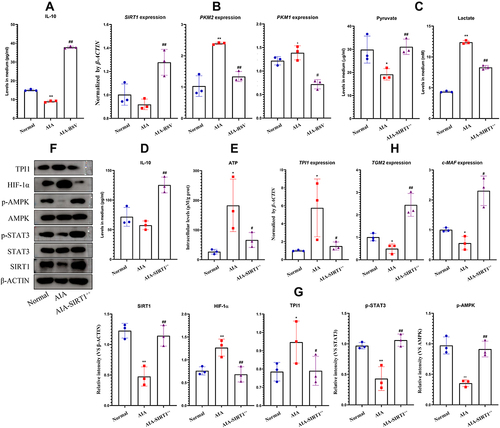
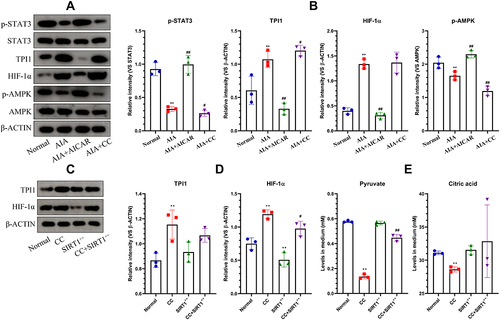
Figure 6 The impacts of AMPK regulation on SIRT1-related changes. (A) Expression of protein TPI1, HIF-1α, p-AMPK, AMPK, p-STAT3, and STAT3 in normal and AIA monocytes treated with AICAR or CC; (B) quantified results of assay A; (C) expression of TPI1 and HIF-1α in normal or SIRT1-overexpressing monocytes treated with CC; (D) quantified results of assay D; (E) levels of pyruvate and citric acid in culture medium from assay C. Statistical significance in image (B) *p < 0.05 and **p < 0.01 compared with normal monocytes, #p < 0.05 and ##p < 0.01 compared with untreated AIA monocytes; statistical significance in image D-E: *p < 0.05 and **p < 0.01 compared with untreated normal monocytes, #p < 0.05 and ##p < 0.01 compared with CC-treated normal monocytes.