Figures & data
Figure 1 The peri-ulcerative mucosal inflammation appearance refers to the degree of mucosal inflammation within 2 cm of the ulcer edge. (A) The mucosa is smooth and soft—with slight hyperemia and edema and without erosion and thickened gastric folds. (B) The mucosa is obviously hyperemic and edematous—with fibrinoid exudate and without thickened gastric folds and erosion. (C) The mucosa is severely hyperemic, edematous, and brittle—with fibrinoid exudate and thickened gastric folds and without erosion. (D) The mucosa is obviously hyperemic, edematous, and brittle—with fibrinoid exudate, erosion, and thickened gastric folds.
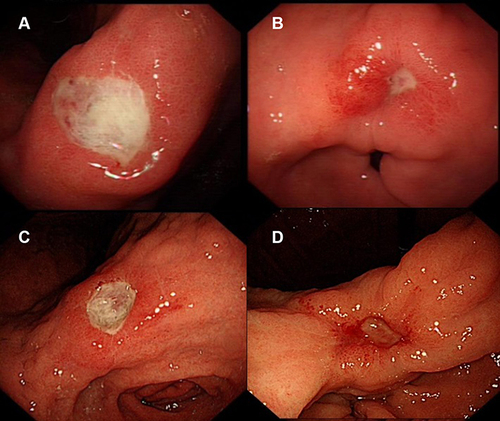
Table 1 Baseline Clinical Characteristics of Study Patients (N=1111)
Table 2 Moderate and Severe Peri-Ulcerative Mucosal Inflammation Appearance Was Analyzed with Mild as Reference
Table 3 Single Factor Analysis of Ulcer Rebleeding After SMOTE
Table 4 Multivariate Binary Logistic Regression Analysis of Ulcer Rebleeding
Figure 2 A nomogram predicting the probability of ulcer rebleeding within 30 days. The scores of each variable are added to obtain the total score, and then a vertical line is subtracted from the row of total-points to estimate the probability of rebleeding.
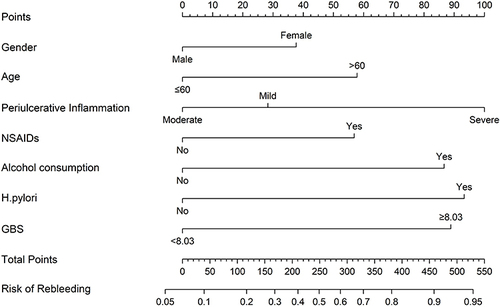
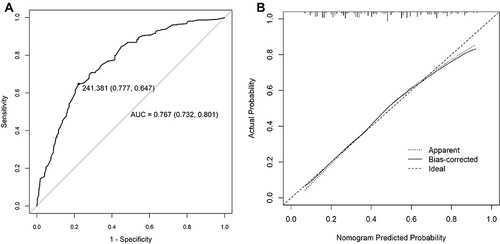
Figure 3 Validation of nomogram for predicting rebleeding. (A) A receiver operating characteristics (ROC) curve of the multivariate logistic regression model. The AUC value was 0.767 (95% CI: 0.732 to 0.801), indicating a good discriminative ability. (B) Calibration plot. The solid line represents the performance of the nomogram, where a closer fit to the diagonal dotted line represents better prediction.