Figures & data
Figure 1 Elevated NINJ1 expression and PMR in gout patients. (A) Western blot of NINJ1 protein in PBMCs that isolated from different groups. (B) LDH levels in the plasma of different groups. (C) DEGs in MSU stimulated BMDMs. (D) RT-PCR of NINJ1 expression in PBMCs that stimulated with indicated reagents. (E) ELISA test of supernatant IL-1β in PBMCs that stimulated with indicated reagents. (F) Western blot of NINJ1 protein in PBMCs that stimulated with indicated reagents. (G) RT-PCR of NINJ1 expression in IL-1β treated PBMCs. (H) Western blot of NINJ1 protein in IL-1β treated PBMCs. Data are shown as mean± SEM. *** P<0.001, **** P<0.0001.
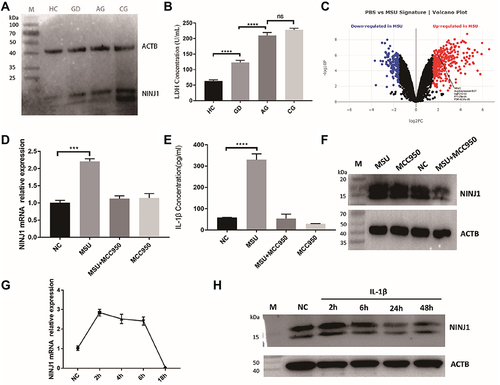
Figure 2 NINJ1 knockdown inhibits rat gout flare. (A) Images of rat joint swelling and redness, and hematoxylin and eosin staining of rat joint inflammation. Asterisks indicate the infiltrating leukocytes. (B) RT-PCR of NINJ1 expression in rat joints. (C) Western blot of NLRP3, pro-IL-1β, and NINJ1 expression in PBMCs of different groups. (D) Compare of individual inflammatory genes expression between MUS treated WT and NINJ1 knockdown animals in PBMCs. (E) Serum mature IL-1β level quantified by ELISA. ***P<0.001, and ****P<0.0001. Three rats were included in each group, and the experiment was repeated for four times. (M) standard protein ladder.
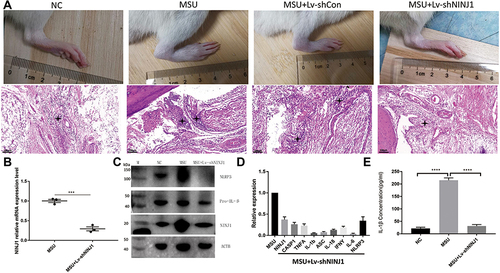
Figure 3 NINJ1 neutralizing antibody prevents murine gout. (A) LDH production after MSU injection into mouse joints at different time points. (B) IL-1beta production after MSU injection into mouse joints at different time points. (C) IL-1β production in different groups. (D) Images of mouse joint swelling and redness in different groups. (E) Mice LDH increase after MSU injection. (F) Histochemical analysis of mouse joint inflammation. Asterisks indicate the infiltrating leukocytes. *P<0.05, **P<0.01. Three mice were included in each group, and the experiment was repeated for four times.
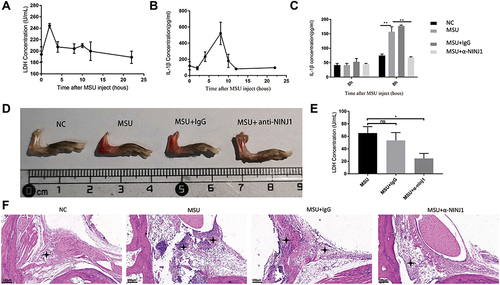
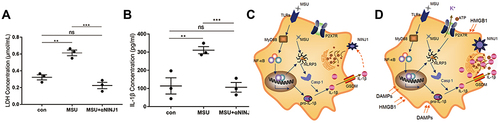
Figure 4 NINJ1 is a potential target for human gout arthritis. (A) LDH levels in different groups. (B) Production of IL-1β from PBMC. (C) MSU activate NLRP3 inflammasome inside of macrophage, which results GSDMD activation and IL-1β secretion. (D) Production of IL-1β upregulate NINJ1 expression on macrophage, NINJ1 then facilitate pyroptosis and PMR, releasing DAMPs including ATP, DNA, LDH, HMGB1 into surroundings. Released DAMPs in turn synergistic with MSU to activate NLRP3 inflammasome leading hyperinflammation and gout flare. ** P<0.01, *** P<0.001.