Figures & data
Figure 1 Work flowchart of clinical cohort establishment and subsequent analysis in this study.
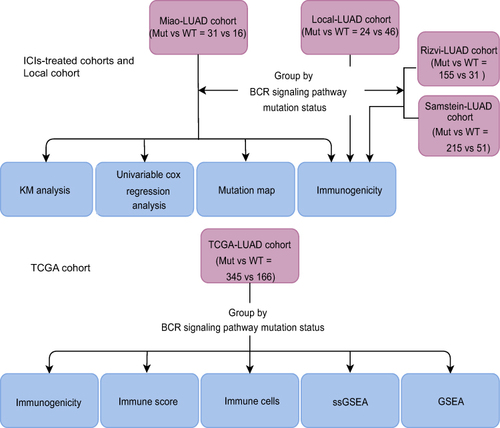
Figure 2 The predictive value of clinical characteristics and the mutation status of the BCR signaling pathway for ICI efficacy. (A) Forest plot of the results of the univariate and multivariate Cox regression analyses in the Miao-LUAD cohort (ICI-treated cohort). The main portion of the forest plot presents the hazard ratios (HR) and 95% confidence intervals (95% CI). The p value represents the statistical significance of the variable. The HR indicates whether the factors are predictors of favorable (HR < 1) or poor (HR > 1) outcomes. KM survival curves for (B) PFS and (C) OS in 47 LUAD patients from the Miao-LUAD cohort.
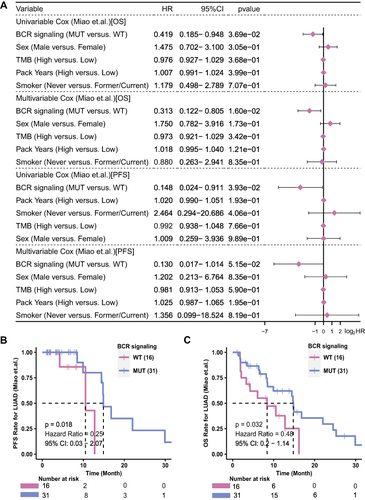
Figure 3 Genomic profiles of 47 LUAD patients in the Miao-LUAD cohort. (A) The 20 genes with the highest mutation frequencies and corresponding clinical information. (B) Mutual exclusion co-occurrence analysis of the top 20 mutated genes. BCR signaling MUT, b cell receptor signaling mutation group, BCR signaling WT, b cell receptor signaling wild group (*p<0.05; **p<0.01; and ***p<0.001).
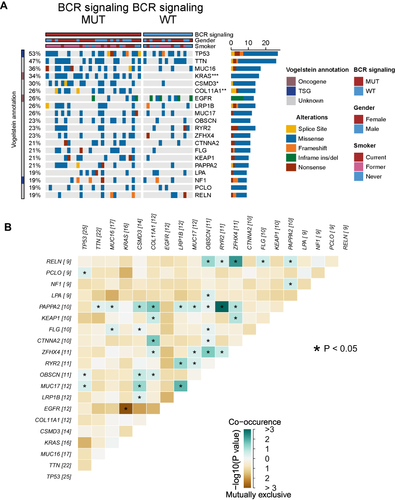
Figure 4 Comparison of TMB between the MUT and WT groups in the (A) Local-LUAD cohort, (B) Rizvi-LUAD cohort, (C) Samstein-LUAD cohort, and (D) TCGA-LUAD cohort. (E) Comparison of DDR related signaling pathways alterations between the MUT and WT groups in the TCGA-LUAD cohort. (F) Comparison of NAL between the MUT and WT groups in the TCGA-LUAD cohort. MUT, B cell receptor signaling pathway mutant type; WT, B cell receptor signaling pathway wild type; (*p<0.05; **p<0.01; ***p<0.001; and ****p<0.0001).
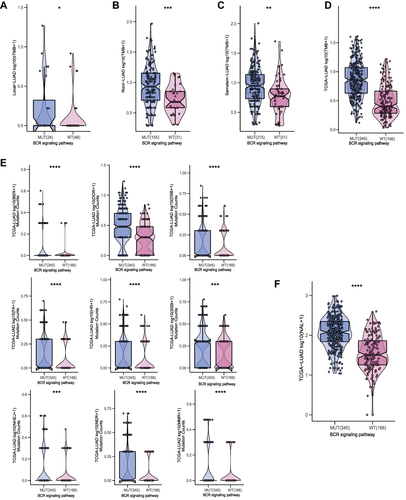
Figure 5 (A) Comparison of the proportions of immune cells estimated by the CIBERSORT method between MUT and WT groups in the TCGA-LUAD cohort. (B) Comparison of immune related scores between MUT and WT groups in the TCGA-LUAD cohort. The immune related scores are Th2 Cell, number of segment score and Homologous recombination score. (C) Results of ssGSEA analysis between MUT and WT groups in the TCGA-LUAD cohort (*p<0.05; **p<0.01; ***p<0.001; and ****p<0.0001; Wilcoxon rank-sum test).
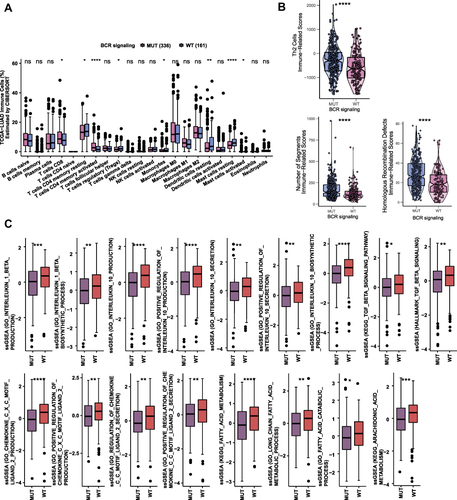
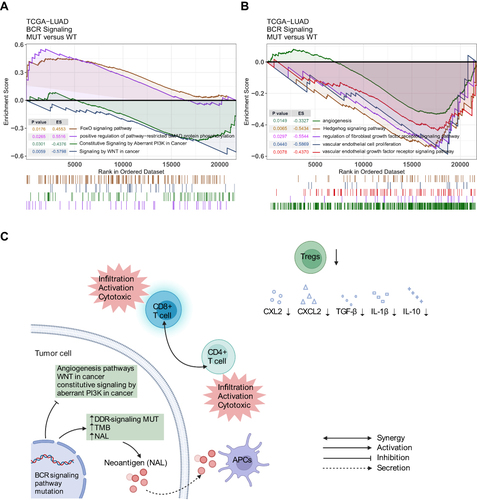
Figure 6 (A and B) Comparison of GSEA analysis between MUT and WT groups in the TCGA-LUAD cohort. (C) Potential mechanism underlying the prognostic value of the BCR signaling pathway mutation.