Figures & data
Figure 1 Graphic workflow of this study, including miRNA sequencing, validation and clinical significance.
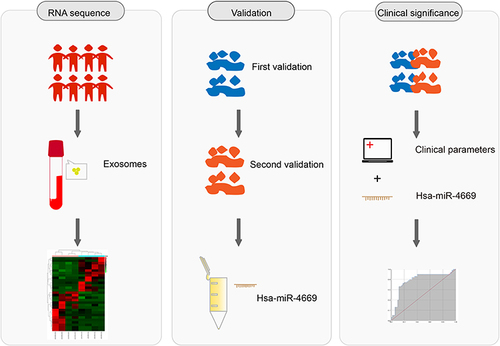
Table 1 The Demographic Character of the First Validation Group
Table 2 The Demographic Character of the Second Validation Group
Figure 2 Identification of serum exosomes. (A) The morphology of serum-derived exosomes was observed by TEM. Scale bar= 100 nm. (B) Particle diameter detection of exosomes.
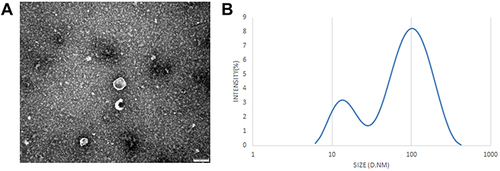
Table 3 Differentially Expressed miRNAs Between the Effective and Ineffective Groups
Figure 3 MiRNA sequencing of serum exosomes. (A) The volcano plots displayed identified miRNAs in the effective and ineffective groups. (B) The heat map showed the cluster analysis of differentially expressed miRNAs (P<0.05).
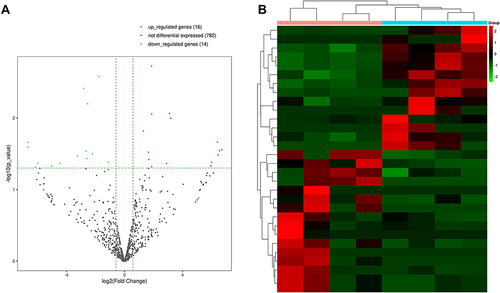
Figure 4 GO analysis of the parental genes of the target mRNAs of the differentially expressed miRNAs, includes the following categories: biological process (BP), cellular component (CC) and molecular function (MF). GO analysis of the target mRNAs of (A–C) upregulated and (D–F) downregulated miRNAs in the effective group.
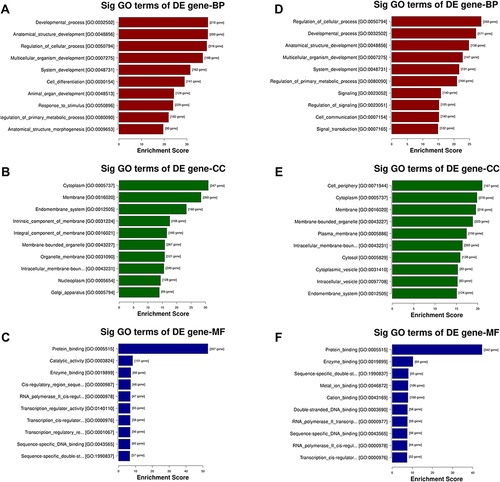
Figure 5 KEGG pathway analysis of the target mRNAs of the differentially expressed miRNAs. (A) Upregulated miRNAs and (B) downregulated miRNAs.
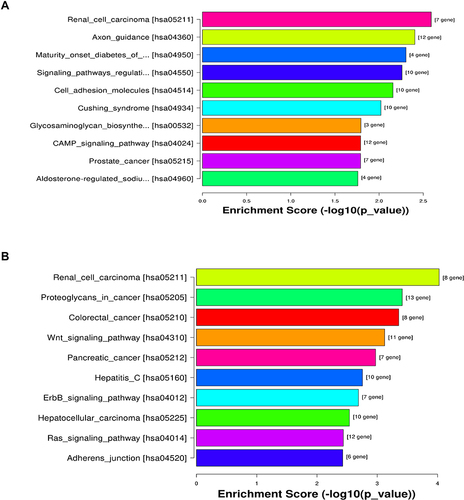
Figure 6 Relative expression level of differentially expressed miRNAs in serum exosomes in the first validation. The identified top three (A) downregulated miRNAs and (B) upregulated miRNAs in the effective group. *P <0.05, **P <0.01.
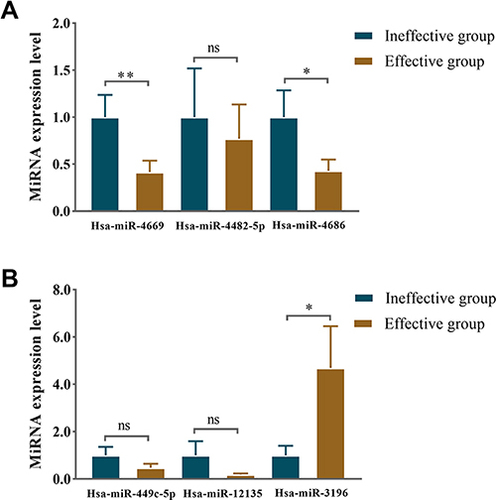
Figure 7 Exosomes derived hsa-miR-4669 was significantly downregulated in the effective group. (A) The relative expression level in nasal mucous of the effective group versus the ineffective group in the second validation. (B) Prediction of potential target genes of hsa-miR-4669. ****P <0.0001.
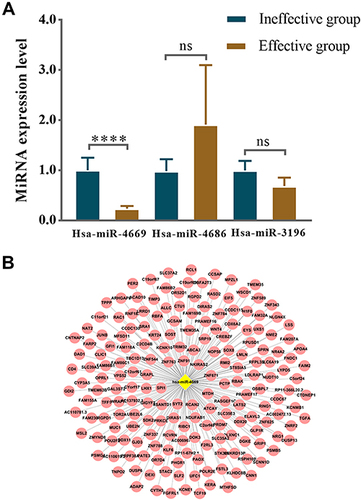
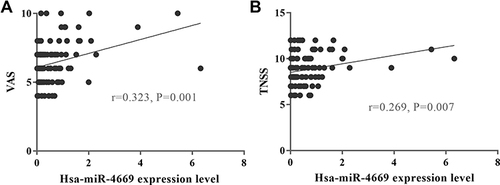
Figure 8 Altered hsa-miR-4669 was correlated with disease severity. Correlation between exosomes derived hsa-miR-4669 level and (A) VAS and (B) TNSS.