Figures & data
Figure 1 Expression, purification, and Western blotting identification of recombinant tropical mite allergens. (A) Construction diagram of recombinant protein. (B) Double enzyme digestion of recombinant plasmid: M, DNA marker (DL5000, Takara, Japan); 1, PQE80L-rBlo t 5 digested with BamHI and SalI; 2, PQE80L-rBlo t 21 digested with BamHI and SalI; 3, PQE80L-rBlo t 5–21 digested with BamHI and SalI. (C–E) Prokaryotic expression and purification of recombinant proteins rBlo t 5, rBlo t 21, and rBlo t 5–21: M, prestained protein marker (26612, ThermoFisher, USA); IPTG (−), bacterial lysate with no IPTG induction; IPTG (+) 1, bacterial lysate with IPTG induction; IPTG (+) 2, supernatant of bacterial lysate with IPTG introduction; E1–E3, protein purified for different times by nickel column. (F) Western blotting analysis of protein: M, prestained protein marker (26616, ThermoFisher, USA); 1, rBlo t 5–21 protein purified by nickel column; 2, rBlo t 5 protein purified by nickel column.
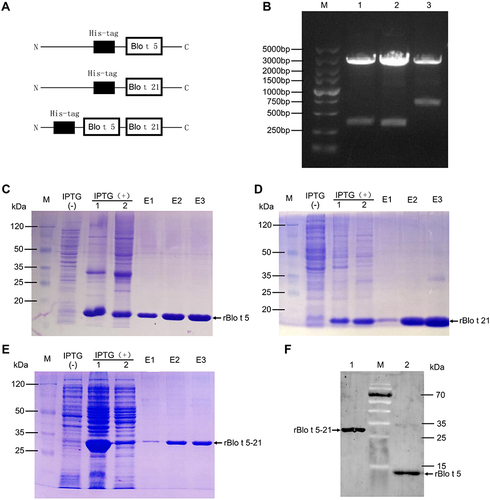
Figure 2 Allergic model mice induced by allergen rBlo t 5–21. (A). Flowchart of induced allergic mice model. After induction of mice allergic model, blood was collected on day 21 to prepare serum for IgE detection (red text). (B). The IgE levels of total serum in mice (n = 5). (C). The temperature change curve (n = 3). (D). Temperature variation curve area statistic chart (n = 3). (E). Mouse lung sections stained with hematoxylin and eosin staining. (F). Statistical chart of lung cell infiltration score in mice (n = 5). *, p < 0.05; **, p < 0.01.
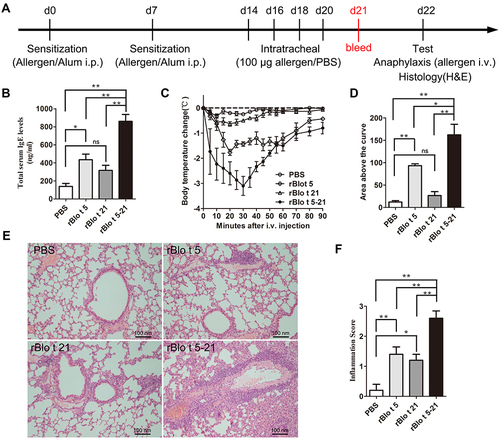
Figure 3 Establishment of recombinant virus-like particles. (A). Structural features of the constituent components of HBcAg. The bar represents the primary sequence of the full-length core protein c1–183 and the sequence of amino acids DPASRE indicates the c/e1 epitope. Additionally, the C-terminal basic domain (clusters of Arg residues) is symbolized by + signs. (B). Chimeric HBcAg-rBlo t 5–21 protein. Amino acids 1 to 149 of HBcAg are retained, then amino acids Pro-79 and Ala-80 of the central c/e1 epitope were replaced by the fusion protein rBlo t 5–21, flanked on both sides by Gly-rich linkers (G4S)2G4 and a 6×His tag was added to the N terminus. (C). prokaryotic expression and purification of recombinant protein HBcAg-rBlo t 5–21: M, Non-prestained protein marker (26610, ThermoFisher, USA); 1, bacterial lysate with no IPTG induction control; 2, bacterial lysate with IPTG induction; 3, chimeric HBcAg-rBlo t 5–21 protein purified by nickel column. (D). Western blotting analysis. M, prestained protein marker (26612, ThermoFisher, USA); 1, HBcAg-rBlo t 5–21 protein; 2, rBlo t 5–21 protein; 3, rBlo t 5 protein. (E). Protein detection by transmission electron microscopy. rBlo t 5–21 protein (left), HBcAg-rBlo t 5–21 protein (middle and right. Right: enlarge the black box.). The black arrows indicate virus-like particles formed by the HBcAg-rBlo t 5–21 protein. (F). The IgG levels of total serum in mice (serum diluted by 1:105, n = 6). Normal mice were randomly divided into two groups. The mice were immunized with different recombinant protein on day 0 and day 7, respectively, and sera were collected on day 21. (G). Curve of temperature change in mice. Asthmatic mice were induced by rBlo t 5–21 and randomly divided into two groups. The allergic mice were subcutaneously immunized with rBlo t 5–21 and HBcAg-rBlo t 5–21 twice with an interval of one week. A week after the treatment ended, allergic mice were challenged intravenously with 50 μg of rBlo t 5–21 per 100 µL PBS to induce anaphylaxis. Body temperatures were measured at regular intervals. (n = 3) (H). Temperature variation curve area statistic chart (n = 3). *, p < 0.05; **, p < 0.01.
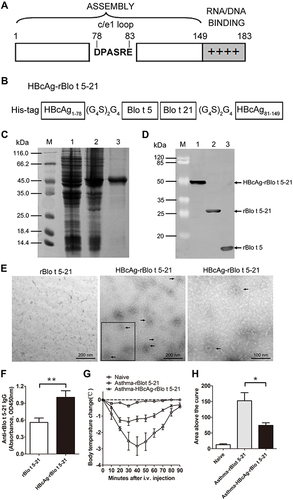
Figure 4 Treatment of allergic mice with HBcAg–rBlo t 5–21. (A). Flowchart of vaccination in allergic model mice. The red font indicates the time point at which the sera were collected. (B). The IgE levels of total serum in mice (Naive group, n = 3; Asthma-PBS group, n = 6; Asthma-HBcAg-rBlo t 5–21 group, n = 6). (C). Curve of temperature change in mice. (Naive group and Asthma-PBS group, n = 6; Asthma-HBcAg-rBlo t 5–21 group, n = 8) (D). Statistical map of body temperature change in mice. (Naive group and Asthma-PBS group, n = 6; Asthma-HBcAg-rBlo t 5–21 group, n = 8) (E). The IgG levels of total serum in mice (serum diluted by 1:105; Naive group, n = 3; Asthma-PBS group, n = 9; Asthma-HBcAg-rBlo t 5–21 group, n = 12). (F). The IgG1 levels of total serum in mice (serum diluted by 1:106; Naive group, n = 3; Asthma-PBS group, n = 9; Asthma-HBcAg-rBlo t 5–21 group, n = 12). (G). The IgG2a levels of total serum in mice (serum diluted by 1:104; Naive group, n = 3; Asthma-PBS group, n = 9; Asthma-HBcAg-rBlo t 5–21 group, n = 12). (H). Changes in IgG1/IgG2a (serum diluted by 1:105; Naive group, n = 3; Asthma-PBS group, n = 9; Asthma-HBcAg-rBlo t 5–21 group, n = 9). (I). Ears prick test. (J). Statistical map of auricle prick test in mice (n = 3). *, p < 0.05; **, p < 0.01.
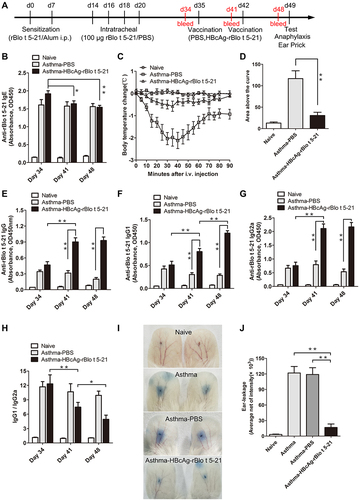
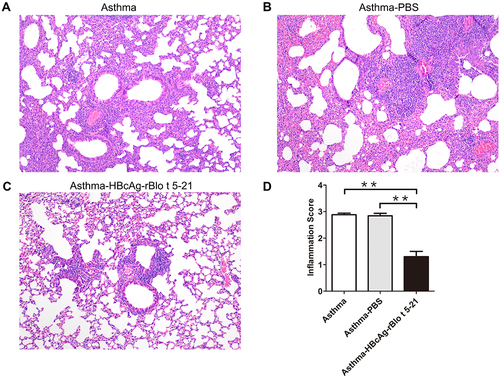
Figure 5 Mouse lung sections stained with hematoxylin and eosin. (A). Untreated model mice (asthma model). (B). PBS-treated model mice (asthma-PBS). (C). Model mice treated with HBcAg–rBlo t 5–21 (asthma–HBcAg-rBlo t 5–21). (D). Lung inflammation was defined as the peribronchial inflammation score (n = 5). Values are expressed as mean ± SEM, ** p < 0.01.