Figures & data
Table 1 Clinical Data of the Study Population
Table 2 Correlation Between miR-10a-3p and Clinical Characteristics
Figure 1 Relative expression level of serum miR-10a-3p. RT-qPCR results showed that the expression level of miR-10a-3p in severe pneumonia group was significantly enhanced compared with healthy individuals. ***P < 0.001.
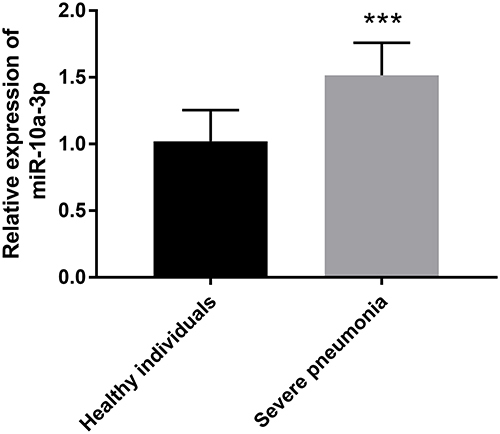
Figure 2 ROC analysis. ROC curve had the ability to distinguish severe pneumonia from healthy people. The AUC of this curve is 0.881, the sensitivity and specificity are 75.7% and 84.0% respectively at the cut-off value of 1.274.
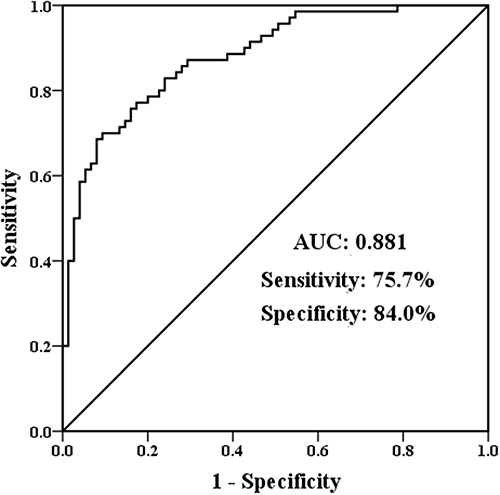
Table 3 Multivariate Cox Analysis of Clinical Characteristics Concerning Overall Survival
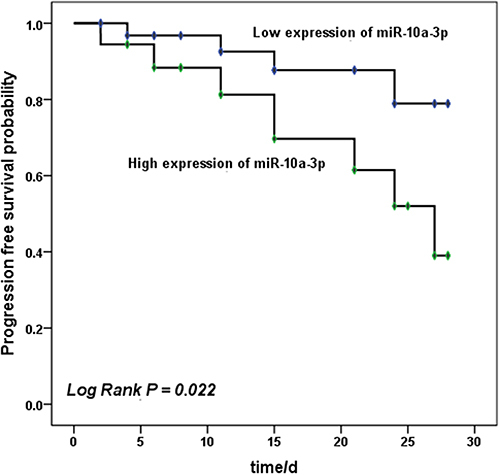
Figure 3 Survival analysis. Kaplan–Meier curve of severe pneumonia group with different miR-10a-3p levels. Patients with low miR-10a-3p level had a higher survival rate. Log Rank P = 0.022.