Figures & data
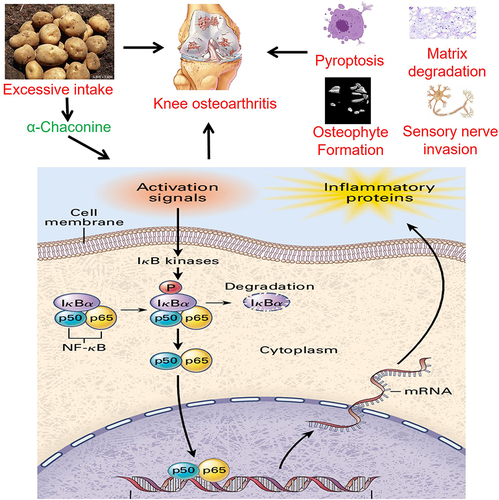
Figure 1 Schematic design of the project.
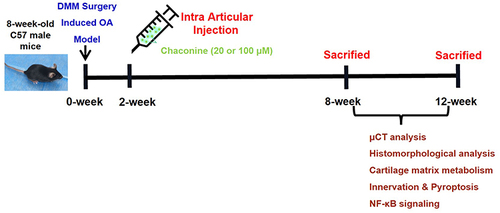
Figure 2 α-Chaconine (α-Cha) deteriorates OA progression. (A) Safranin O/Fast green staining of cartilage. (B) OARSI scores for cartilage structure damage in (A). (C-C’) Representative three-dimensional images of knee joints. Three-dimensional reconstructions of knee joints in (C) and osteophytes (C’) were used to visualize calcification of meniscus and osteophyte formation 8- and 12-week after DMM surgery. Yellow triangles indicated osteophytes. (D–H) Statistical results of bone morphological parameters in (C). Data were expressed as the mean ± SD. *P < 0.05, **P < 0.01 vs Sham group, #P < 0.05, ##P < 0.01 vs Vehicle group.
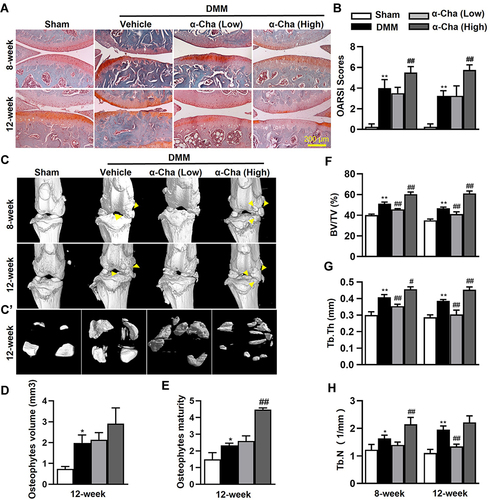
Figure 3 α-Chaconine accelerates articular cartilage matrix degradation. (A–C) Immunohistochemistry results of Col2, Mmp3, and Mmp13 proteins. (D–F) The ratios of immunoreactive positive cells of Col2, Mmp3, and Mmp13 in (A–C). Data were expressed as the mean ± SD. **P < 0.01 vs Sham group, #P < 0.05, ##P < 0.01 vs Vehicle group.
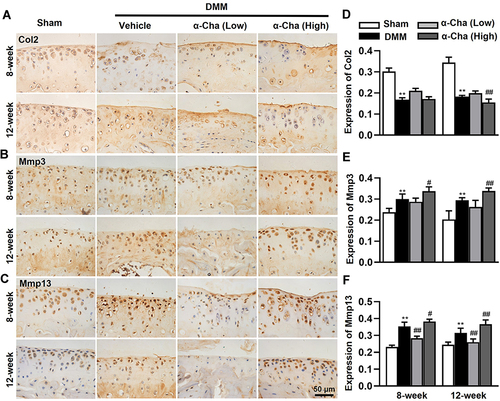
Figure 4 α-Chaconine promotes chondrocyte pyroptosis. (A–E) Immunohistochemistry staining results of Nlrp3, Caspase-1, Gsdmd, IL-1β, and IL-18 proteins in articular cartilage 8- and 12-week post-DMM surgery. (F–J) The ratios of immunoreactive positive cells of Nlrp3, Caspase-1, Gsdmd, IL-1β, and IL-18 in (A–E). Data were expressed as the mean ± SD. **P < 0.01 vs Sham group, #P < 0.05, ##P < 0.01 vs Vehicle group.
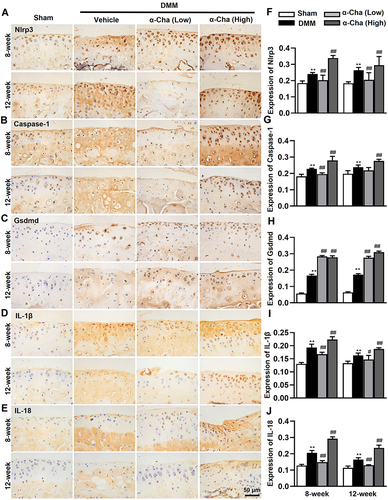
Figure 5 α-Chaconine recruits sensory nerve ingrowth in subchondral bone. (A and B) Immunofluorescence staining of Cgrp and Netrin-1 in subchondral bone 8- and 12-Week post-surgery. (C and D) Quantification of Cgrp-positive cells and positive staining of Netrin-1 in cartilage. (E and F) Quantification of Cgrp-positive cells and positive staining of Netrin-1 in subchondral bone. Red arrows indicated Cgrp-positive neurons and positive expression of Netrin-1. Data were expressed as the mean ± SD. **P < 0.01 vs Sham group, #P < 0.05, ##P < 0.01 vs Vehicle group.
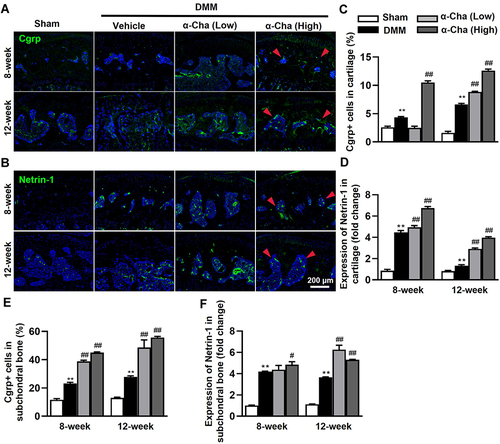
Figure 6 α-Chaconine activates NF-κB signaling pathway of knee joint. (A and B) Immunofluorescence staining of p65 and p-i-κBα both in articular cartilage and subchondral bone 8 and 12-week post-surgery. (C and D) Quantification of p65 and p-i-κBα positive cells in cartilage. (E and F) Quantification of p65 and p-i-κBα positive cells in subchondral bone. Red arrows indicate the positive expression of p65 and p-i-κBα. Data are expressed as the mean ± SD. **P < 0.01 vs Sham group, ##P < 0.01 vs Vehicle group.
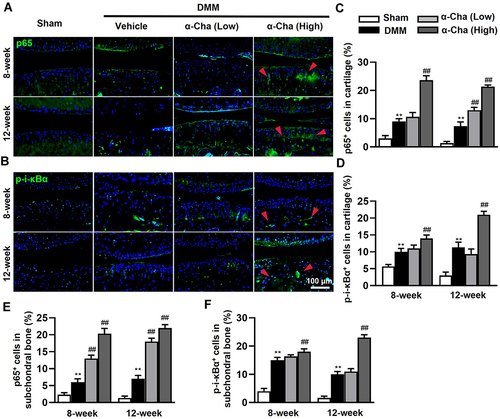
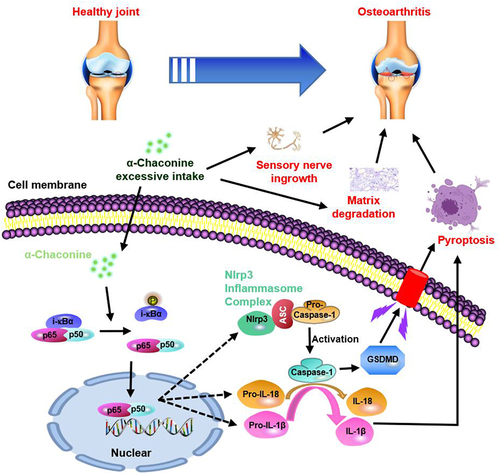
Figure 7 A schematic diagram illustrating the role of α-Chaconine in exacerbating OA progression.