Figures & data
Figure 1 Boxplots to show dynamic change trends of NLR (A) and LMR (B).
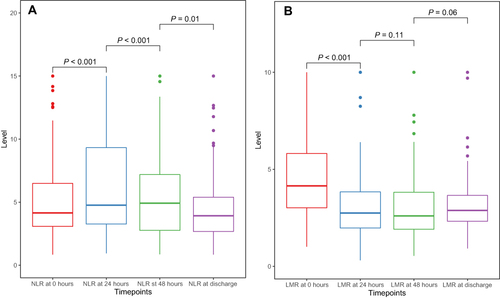
Table 1 Baseline Characteristics Between No-ENI and ENI Group in Patients Treated with IV tPA
Figure 2 Multivariable logistics regression analyses: (A) adjusted for admission NIHSS score; (B) adjusted for bridging MT, admission NIHSS score and large vessel occlusion.
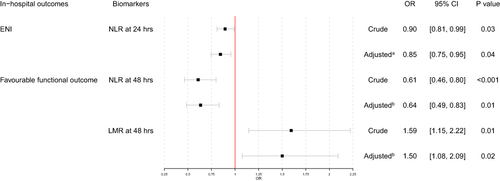
Table 2 Baseline Characteristics Between mRS 2–6 and mRS 0–1 at Discharge Group in Patients Treated with IV tPA
Figure 3 Receiver operating characteristic curves. (A) ROC curve for LMR at 24 hours to predict ENI; (B) ROC curve for NLR at 48 hours to predict favorable functional outcome at discharge; (C) ROC curve for LMR at 48 hours to predict favorable functional outcome at discharge.
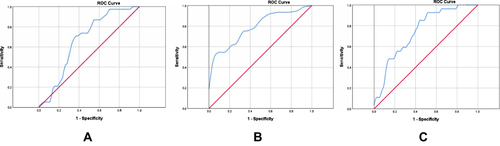
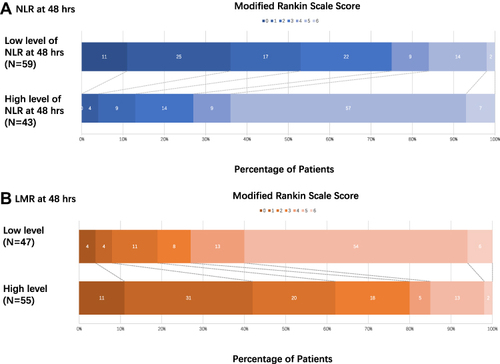
Figure 4 Distribution of mRS score at discharge between different level of NLR/LMR at 48 hours. Scores range from 0–6, with 0 indicating no symptoms, 1 no clinically significant disability, 2 slight disability (patients are able to look after their own affairs without assistance but are unable to carry out all previous activities), 3 moderate disability (patients require some help but are able to walk unassisted), 4 moderately severe disability (patients are unable to attend to bodily needs without assistance and are unable to walk unassisted), 5 severe disability (patients require constant nursing care and attention), and 6 death. (A) For NLR at 48 hours, high level of NLR at 48 hours represented poor functional outcome at discharge, common OR was 0.09 and 95% CI was 1.54–3.18 (P<0.001). (B) For LMR at 48 hours, high level of LMR at 48 hours represented favorable functional outcome at discharge, common OR was 7.87 and 95% CI was 1.27−2.85 (P<0.001).